Chainlink (LINK) Hovers above $19 Support Amidst Bullish Expectation
Estimated Reading Time: 2 minutes
Don’t invest unless you’re prepared to lose all the money you invest. This is a high-risk investment and you are unlikely to be protected if something goes wrong. Take 2 minutes to learn more
Chainlink (LINK) Long-Term Analysis: Bearish
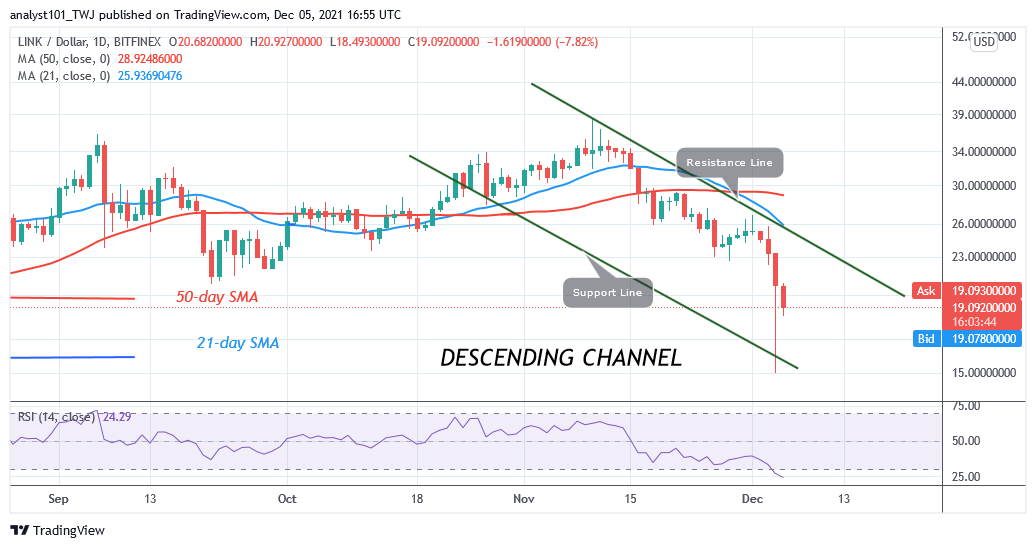
Chainlink’s (LINK) price has plunged to $15 low as bulls bought the dips. LINK price has corrected upward as the altcoin fell to low at $15 support. The $19 is the historical price level of July 28. The cryptocurrency is at level 24 of the Relative Strength Index for period 14. The selling pressure has reached bearish exhaustion as the market reached the oversold region.
Chainlink (LINK) Indicator Analysis
Chainlink’s price bars are below the moving averages which cause the altcoin to decline in the bearish trend zone. The cryptocurrency is at level 24 of the Relative Strength Index for period 14. It indicates that LINK/USD is now in the oversold region of the market. The implication is that the downtrend will soon end. LINK is below the 20% range of the daily stochastic. The altcoin is now in the oversold region.
Technical indicators:
Major Resistance Levels – $40.00, $42.00, $44.00
Major Support Levels – $26.00, $24.00, $22.00
What Is the Next Direction for Chainlink (LINK)?
On the 4-hour chart, LINK is hovering above the $19 support level. The uptrend will resume if the current support holds. Meanwhile, on November 26 downtrend; a retraced candle body tested the 78.6% Fibonacci retracement level. The retracement indicates that LINK will fall but reverse at level 1.272 Fibonacci extensions or $18.84.

You can purchase crypto coins here. Buy Token
Note: Cryptosignals.org is not a financial advisor. Do your research before investing your funds in any financial asset or presented product or event. We are not responsible for your investing results