BNB (BNB/USDT) Poised for Breakout Amid Short-term Consolidation
Estimated Reading Time: 3 minutes
Don’t invest unless you’re prepared to lose all the money you invest. This is a high-risk investment and you are unlikely to be protected if something goes wrong. Take 2 minutes to learn more
BNB Long-term Analysis: Ranging
The market for BNB against the Tether appears to be in a long-term bullish position, supported by price action above the Guppy Multiple Moving Averages (GMMAs). However, though the price remains within a strong upside trajectory, recent price actions signal a temporary consolidation phase.
The pair has declined in volume by 0.48%, suggesting a volatility squeeze and a potential breakout if momentum increases. To this end, caution is needed, as the momentum oscillator indicates a waned bullish pressure.
Currently, BNB trades at $648.77, recording traded volumes close to 20 thousand at the beginning of the week.
Technical Indicators
Major Resistance Levels: $655, $680, and $720
Major Support Levels: $641, $620, and $600
BNB Technical Analysis
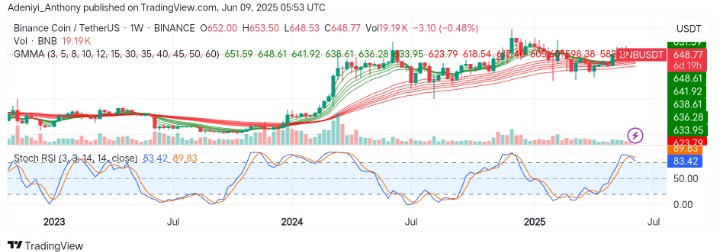
The analysis of BNB against the Tether on the weekly chart shows the pair is currently in a coiled bullish structure, consolidating under the $655 resistance level but remaining above the compressed sets of EMAs.
However, the Stochastic RSI indicates the pair still operates in the overbought region but with a coiled blue line towards the south. This suggests strong bullish pressure and caution as the lines approach the 70-mark level.
To this end, a 1% increase in the price level supported by increased bullish volume would signal a move towards $680 and above. However, a decline in value below $638 would invalidate this move.
BNB/USDT Analysis: What’s Next?
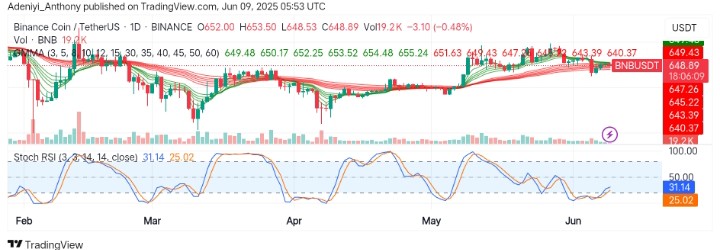
On the daily chart, BNB/USDT remained capped under the $655 level but still above the GMMAs, printing lower highs and some flat lows as the set of EMAs remained compressed.
The Stochastic RSI, on the other hand, appears to be recovering from the oversold zone, hinting at a possible bounce, though there is no volume spike.
To this end, a decisive move above the immediate resistance level would lead to a breakout above $680 in the near term. Conversely, a break below $640 could expose the $625 support line.
You can purchase crypto coins here. Buy LBlock