SPONGE/USD ($SPONGE) Bulls Are Strong Around $0.00027
Estimated Reading Time: 2 minutes
Don’t invest unless you’re prepared to lose all the money you invest. This is a high-risk investment and you are unlikely to be protected if something goes wrong. Take 2 minutes to learn more
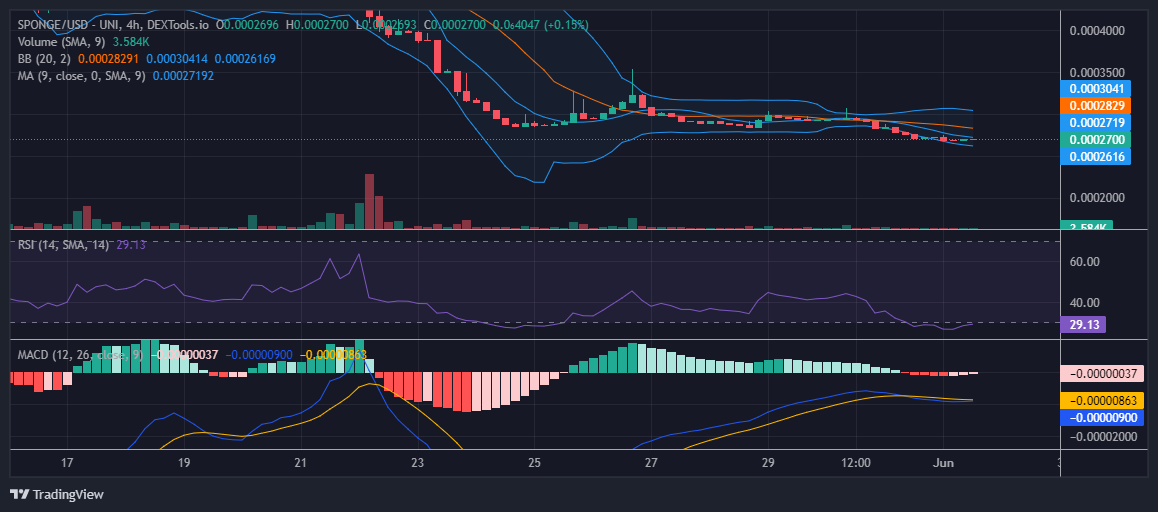
Recently in the $SPONGE market, the struggle between demand and supply around the $0.00029 price level intensified, and when the struggle reached its climax, it broke to the downside in favor of bears. However, the Sponge bear market did not go too far as it encountered strong bullish support at $0.00027. The price should rally from this level.
Key Levels
- Resistance: $0.00035, $0.00040, and $0.00045
- Support: $0.00025, $0.00020, and $0.00019
SPONGE/USD ($SPONGE) Price Analysis: The Indicators’ Point of View
From the Relative Strength Index (RSI), $SPONGE is appearing in the oversold section. Apart from the present bullish sentiment at the current level in the market, the information from the Relative Strength Index (RSI) could contribute to the upturn of the market. Already, the indicators are pointing to a bullish recovery, but the market needs a spike in the supply of trading volume to propel it on its bullish course.
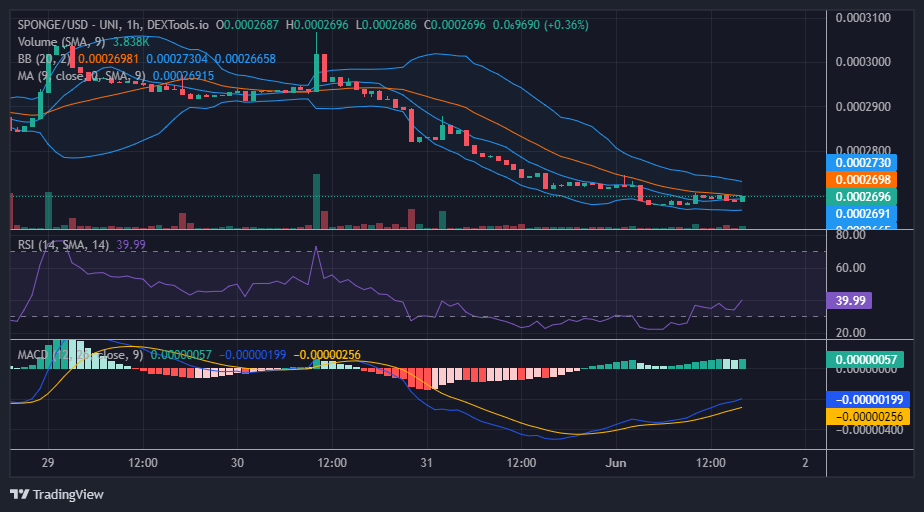
SPONGE/USD Short-Term Outlook: 1-Hour Chart
From the 1-hour timeframe, through the help of the Bollinger Bands indicator, we are able to see that the market is indeed turning northward. However, with the support level at $0.0002678, the market is facing resistance too soon at $0.00027. The resistance level is the same level as the 20-day moving average. Despite the resistance, the market at its current level is more to rise than to fall.
$SPONGE is now live on UniSwap!
#SPONGERS!!! 🧽🌊
Trade $SPONGE on @Uniswap today! 💸💫
Absorb all the damp! 💦🌪️https://t.co/ZWaNBhPPGl pic.twitter.com/YCZWlFGABo
— $SPONGE (@spongeoneth) June 1, 2023
Invest in the hottest and best meme coin. Buy Sponge ($SPONGE) today!