Uniswap (UNI/USD) Trade Operation Surges Past $30
Estimated Reading Time: 3 minutes
Don’t invest unless you’re prepared to lose all the money you invest. This is a high-risk investment and you are unlikely to be protected if something goes wrong. Take 2 minutes to learn more
Uniswap Price Prediction – September 2
The crypto-economic trade operation of the UNI/USD surges past the level of $30 during a volatile price action that took place yesterday, marking the first day of the new month’s sessions. Currently, the market witnesses negativity in the percentage rate at about -3.25 to trade in a reversal moving motion toward the point mentioned earlier.
UNI/USD Market
Key Levels:
Resistance levels: $34, $37, $40
Support levels: $27, $26, $25
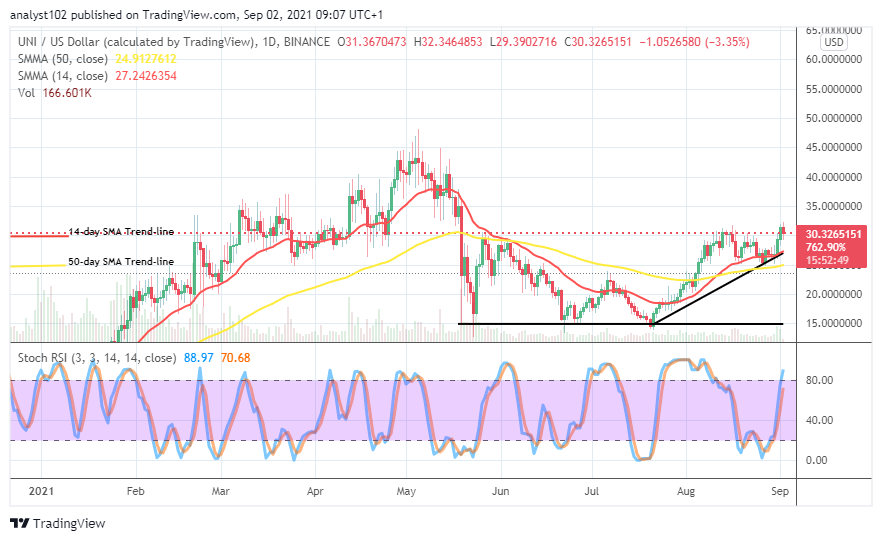
UNI/USD – Daily Chart
The UNI/USD daily chart showcases that the crypto trade operation surges past the line of $30 to touch a resistance around the mid-point of $35 and the value mentioned at the beginning. The emergence of August 31 st bullish candlestick on the buy signal side of the smaller SMA trend-line gave a better edge to project the market into breaking resistances in the following day marking the beginning of a new month. The 50-day SMA is underneath the 14-day SMA. The bullish trend-line drew northward to support the smaller SMA indicator. The Stochastic Oscillators have moved the blue line slightly past the range 80 into the overbought region, pointing to the north. That suggests that the pressures to the upside aren’t probably exhausted.
Will the UNI/USD market hold above $30 as the crypto trade operation surges past it?
The pressure that led to the up surging of the UNI/USD price above $30 seems not that weighty enough as even the crypto trade operation surges past it. That said, the point would now have to be the line around which the market bulls may be on the lookout to build support for further upsides. A vital resistance line awaits any sudden northward price movement around $35.
On the downside, active reversal price action that tends to take place between the points of $35 and $30 may in no time allow the UNI/USD market bears to regain the crypto price control once again for a while. The positioning of the SMAs below the current trading spot indicates that it may take some time before the price could further go down if there will be a need. Therefore, the bears’ trap could set in while price only aims a slight decline around the smaller value mentioned earlier.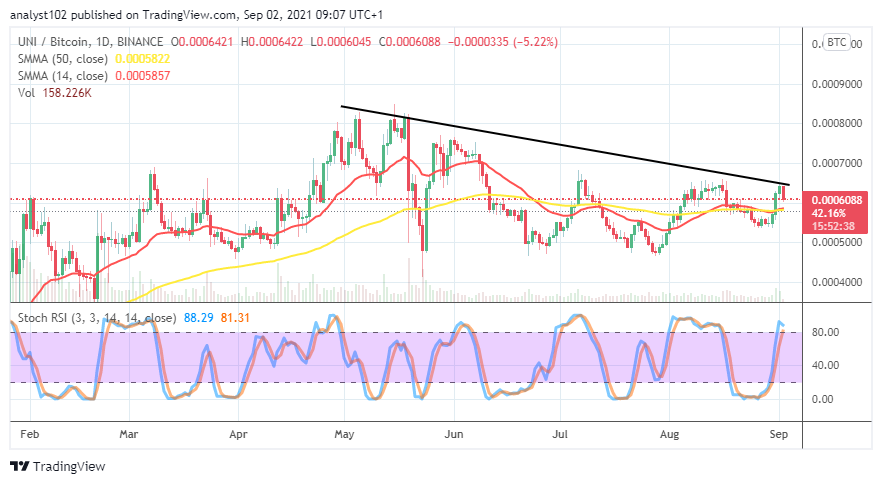
UNI/BTC Price Analysis
In comparison, It indicated that the duo-crypto trade operation surges past the SMA trend-lines on the UNI/BTC price analysis chart. In other words, it means that the base crypto’s trends are a bit higher against the counter crypto. The 14-day SMA indicator has conjoined with the 50-day SMA indicator at the tail end. The Stochastic Oscillators are in the overbought region, seemingly attempting to close the lines near around the range of 80. That could mean that UNI’s trending capacity may witness a low-active motion as paired with that of BTC in the near time.
Note: Cryptosignals.org is not a financial advisor. Do your research before investing your funds in any financial asset or presented product or event. We are not responsible for your investing results.
You can purchase crypto coins here. Buy Tokens