Wall Street Memes (WSM/USD) Price Is in Ranges, Holding Rises
Estimated Reading Time: 3 minutes
Don’t invest unless you’re prepared to lose all the money you invest. This is a high-risk investment and you are unlikely to be protected if something goes wrong. Take 2 minutes to learn more
Wall Street Memes Price Prediction – January 14
The pricing proceedings that have predominated the activities of movements in Wall Street Memes versus the trade stances of the US currency have continued to be in the form of letting long-term investors stake to garner points, given that the crypto economy is currently in ranges, holding rises.
Buyers should find it more advantageous to initiate longing orders and let the positions run without any obstacles in order to secure the best long-term rebounds, regardless of the bears’ tendency to push back downward from toward or eventually against the lower Bollinger Band positioning level.
WSM/USD Market
Key Levels
Resistance levels: $0.0012, $0.0017, $0.0022
Support levels: $0.0007, $0.0005, $0.0003
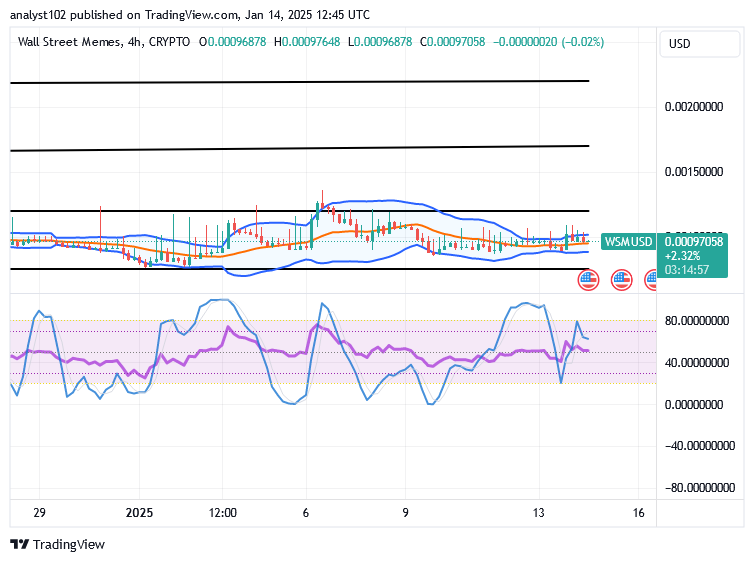
WSM/USD – 4-hour Chart
The WSM/USD 4-hour chart shows that the WSM/USD market is in ranges, holding rises within the stretching territories of the Bollinger Bands.
The stochastic oscillators are now freely swerving up and down through different points without any definite setting signal, causing a degree of indecision at this moment. The indicators of the Bollinger Bands are slightly getting a repositioning pattern to the upside in the horizontal boundary lines of $0.0012 and $0.00075.
Given that the WSM/USD market is now trading in ranges, which area of the Bollinger Bands should be strategically chosen as the ideal location to place long orders?
Execution of purchases has to be between the zones of the middle and the lower Bollinger Bands, as the WSM/USD market operation features in ranges, holding rises.
It is also crucial for traders and investors to avoid the tendency to sell off the majority of position orders that have been placed around the $0.0012 horizontal line or around the upper Bollinger Band signal. Nevertheless, the trade optimism that underpins the dip-buy strategy is still rising and will soon see consistent rallying forces.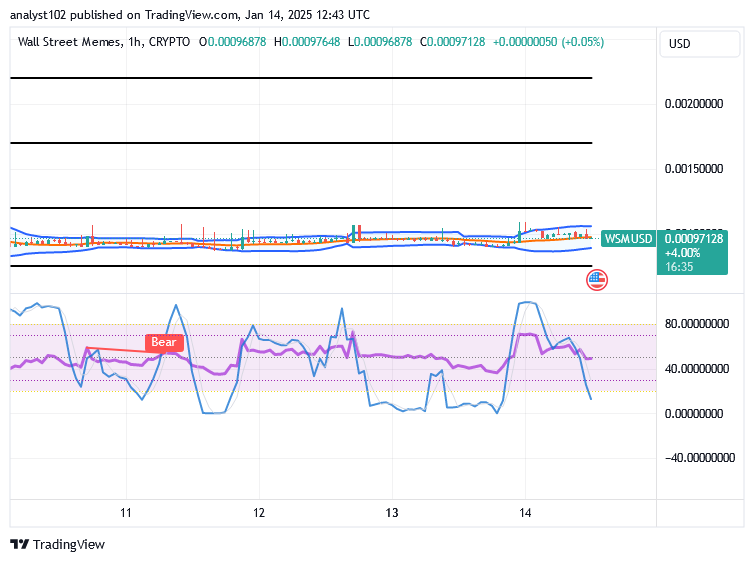
WSM/USD 1-hour chart
The 1-hour chart showcases that the crypto-economic market is in ranges, holding rises at a particular lower trade zone.
There has been a steady stretching mode to denote the way that the Bollinger Bands indicators have been positioning. The stochastic oscillators have turned to the negative direction into the oversold region under a bearish signal note. Nevertheless, the decline is to potentially allow buying options to come up with a level of decency.
Buy and stake WSM now!: Wall Street Meme (WSM)