Wall Street Memes (WSM/USD) Price Bumps, Fine-Tuning a Base
Estimated Reading Time: 3 minutes
Don’t invest unless you’re prepared to lose all the money you invest. This is a high-risk investment and you are unlikely to be protected if something goes wrong. Take 2 minutes to learn more
Wall Street Memes Price Prediction – January 13
At this time of this analytics, bulls have been striving harder to hold against the probable fall-offs in the operations of the WSM/USD market, as the financial situation shows that the price bumps, fine-tuning a base.
As the indicators are placed at certain oversold zones with a positioning stance that tends to indicate back northward, it would be technically advantageous for investors to follow the oscillating swings from the viewpoint of lower trade charts. In order to maybe establish decency in the style of longing orders, the lower portion of the Bollinger Bands has been observed extending eastward just over the $0.00075 mark.
WSM/USD Market
Key Levels
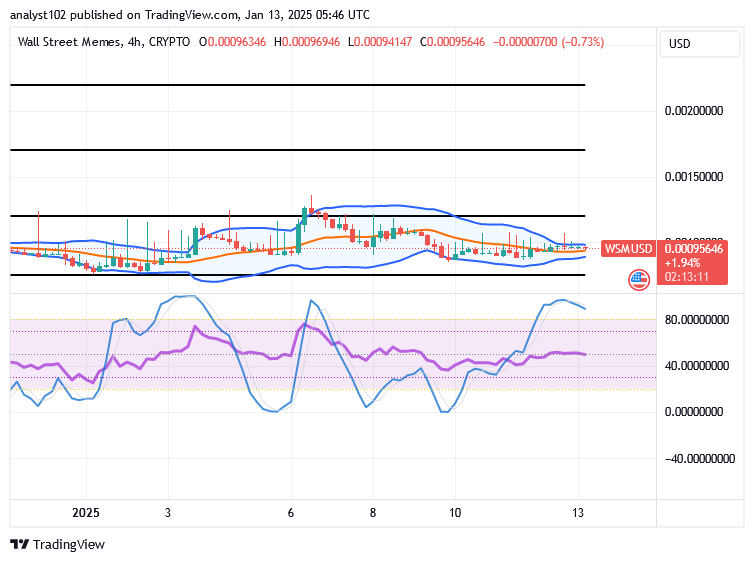
Resistance levels: $0.0012, $0.0017, $0.0022
Support levels: $0.0007, $0.0005, $0.0003
WSM/USD – 4-hour Chart
The WSM/USD 4-hour chart reveals that the crypto-economic price currently bumps, fine-tuning a base above $0.0007.
The fact that the stochastic oscillators have entered the overbought area indicates that a pause will probably last for several sessions. This suggests that purchasers could be waiting for the right moment to flee north. The trend lines of the Bollinger Bands have been able to align themselves with a variety of candlestick range patterns.
Should long-term investors in the WSM/USD market start the positions staking procedure until the oscillators have returned to an oversold region?
Considering the trade level of the current activities of the WSM/USD market, it appears that it is not necessary to wait until the oscillating tools shift southward, given that the base instrument bumps, fine-tuning a base.
In order to create a favorable atmosphere for buyers, pricing schemes that have centered mostly on the Bollinger Band trend lines have produced patterns that are mostly at lower highs than lower lows. It is recommended that investors continue to accrue points prior to steady recoveries.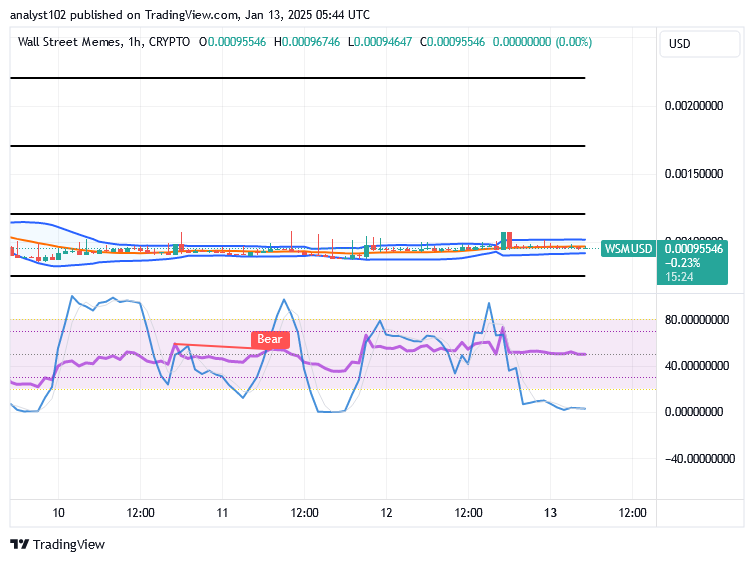
WSM/USD 1-hour chart
The 1-hour chart mirrors that the crypto-economic trade bumps, fine-tuning a base around the lower Bollinger Band.
The stochastic oscillators have moved south to take a position in the oversold area under a negative outlook. Around $0.001, the Bollinger Bands’ trend lines are still being extended eastward. The candlestick feature pattern has been horizontal for the past few hours.
Buy and stake WSM now!: Wall Street Meme (WSM): https://wallstmemes.com/