Cardano Faces Rejection at $0.55 High as It Declines to the Range-Bound Zone
Estimated Reading Time: 2 minutes
Don’t invest unless you’re prepared to lose all the money you invest. This is a high-risk investment and you are unlikely to be protected if something goes wrong. Take 2 minutes to learn more


Free Crypto Signals Channel
Cardano (ADA) Long-Term Analysis: Ranging
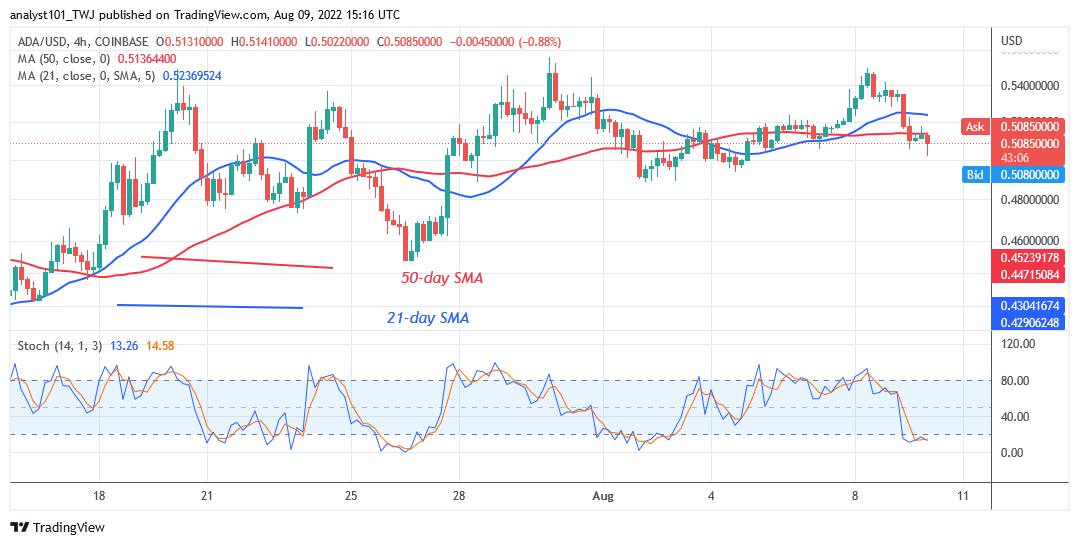
Cardano’s (ADA) price has continued its range-bound move above the moving average lines but declines to the range-bound zone. Generally, the price movement has been stagnant because of the appearance of Doji and Spinning tops. On the upside, the bulls fail to break the resistance at $0.55, as the selling pressure resumes. On August 9, ADA price declined above the moving average lines. However, the downtrend will resume if the bears break below the moving average lines. That is, Cardano will further decline to the low of $0.40. Meanwhile, ADA/USD is trading at $0.50 at the time of writing.
Cardano (ADA) Indicator Analysis
ADA is at level 51 of the Relative Strength Index for period 14. It indicates that there is a balance between supply and demand. The 21-day line SMA and the 50-day line SMA are sloping horizontally indicating a sideways trend. ADA is below the 20 % range of the daily stochastic. The market has reached the oversold region.
Technical indicators:
Major supply zones: $2.0, $2.20, $2.40
Major demand zones: $1.40, $1.20, $1.00
.What Is the Next Direction for Cardano (ADA)?
Cardano price is in a sideways move but declines to the range-bound zone. The crypto’s price has remained stagnant because of the presence of small body indecisive candlesticks called Doji and Spinning tops. The candlesticks indicate that buyers and sellers have reached a period of indecision.
You can purchase crypto coins here. Buy LBlock
Note: Cryptosignals.org is not a financial advisor. Do your research before investing your funds in any financial asset or presented product or event. We are not responsible for your investing results