Osmosis (OSMO/USD) Eyes Rebound as Bearish Pressure Eases
Estimated Reading Time: 4 minutes
Don’t invest unless you’re prepared to lose all the money you invest. This is a high-risk investment and you are unlikely to be protected if something goes wrong. Take 2 minutes to learn more
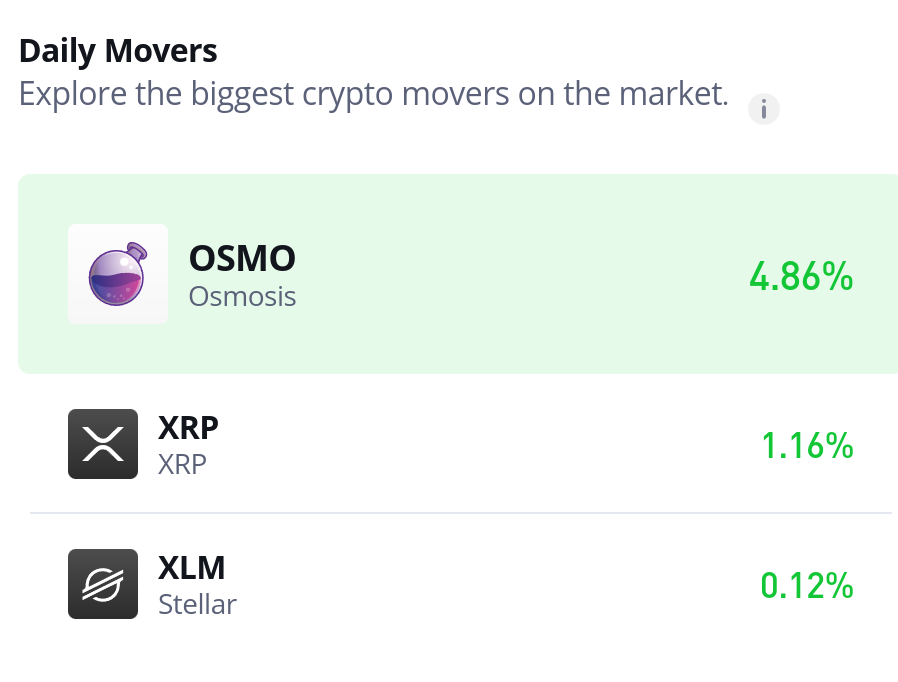
Osmosis (OSMO/USD) is showing signs of a potential recovery, gaining approximately 4.86% during today’s trading session—an encouraging move that has drawn renewed attention from traders.
Earlier, the market had been in a consistent downtrend, declining from the $0.27 level and eventually bottoming out around $0.137. This prolonged bearish phase appears to have paused, with today’s price action signaling a possible reversal.
In the past several hours, OSMO has exhibited a clear bullish impulse, suggesting that buyer interest is returning at current levels. The decisive bounce observed in today’s session marks a key turning point and, if sustained, could lead to the beginning of a broader bullish trend.
While it’s still early to confirm a full trend reversal, the recent price behavior is promising. Continued upward momentum and follow-through in upcoming sessions will be crucial in determining whether this bounce evolves into a sustained rally. Traders are advised to monitor support and resistance levels closely as the market seeks further direction.
Osmosis (OSMO/USD) Market Data
- OSMO/USD Price Now: $0.154
- OSMO/USD Market Cap: $107 million
- OSMO/USD Circulating Supply: 735.6 million OSMO
- OSMO/USD Total Supply: 996.7 million
- OSMO/USD CoinMarketCap Ranking: #71
Key Levels
- Resistance: $1.160, $0.170, and $0.180
Support: $0.150, $0.140, and $0.130
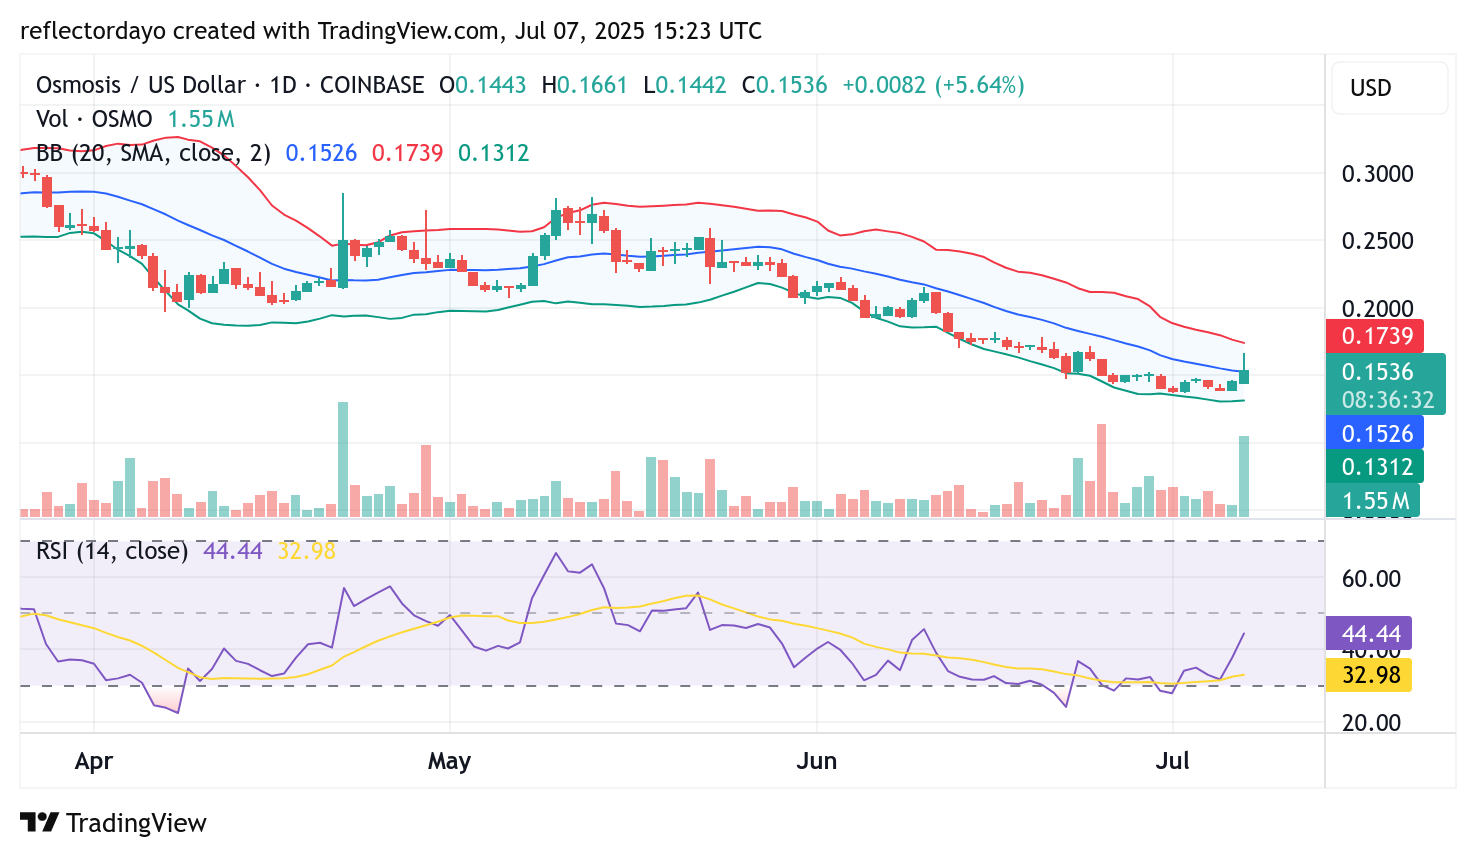
Osmosis (OSMO/USD) Daily Chart Outlook: Bulls Eye Recovery Amid Rising Activity
The daily chart of Osmosis (OSMO/USD) reveals a notable spike in trading volume, as reflected by the heightened activity on the volume histogram. This surge in participation initially drove the price upward, but upon reaching the $0.165 resistance level, the market encountered selling pressure.
Profit-taking by short-term traders triggered a mild correction, pulling the price back to around $0.154. Despite the pullback, the crypto signal remains slightly above the 20-day moving average, suggesting that bullish momentum is still in play—though more confirmation is needed for a full trend reversal.
The recent consolidation, coupled with a modest bounce from support, signals that the market may be gearing up for another upward attempt. However, bulls will need to maintain buying pressure and push above key resistance levels to solidify the recovery.
For now, the $0.15 level serves as a critical zone to watch. If the market holds above this level and resumes its upward trajectory, it could mark the beginning of a broader bullish phase. Traders are advised to monitor the price action closely in the near term for further confirmation.
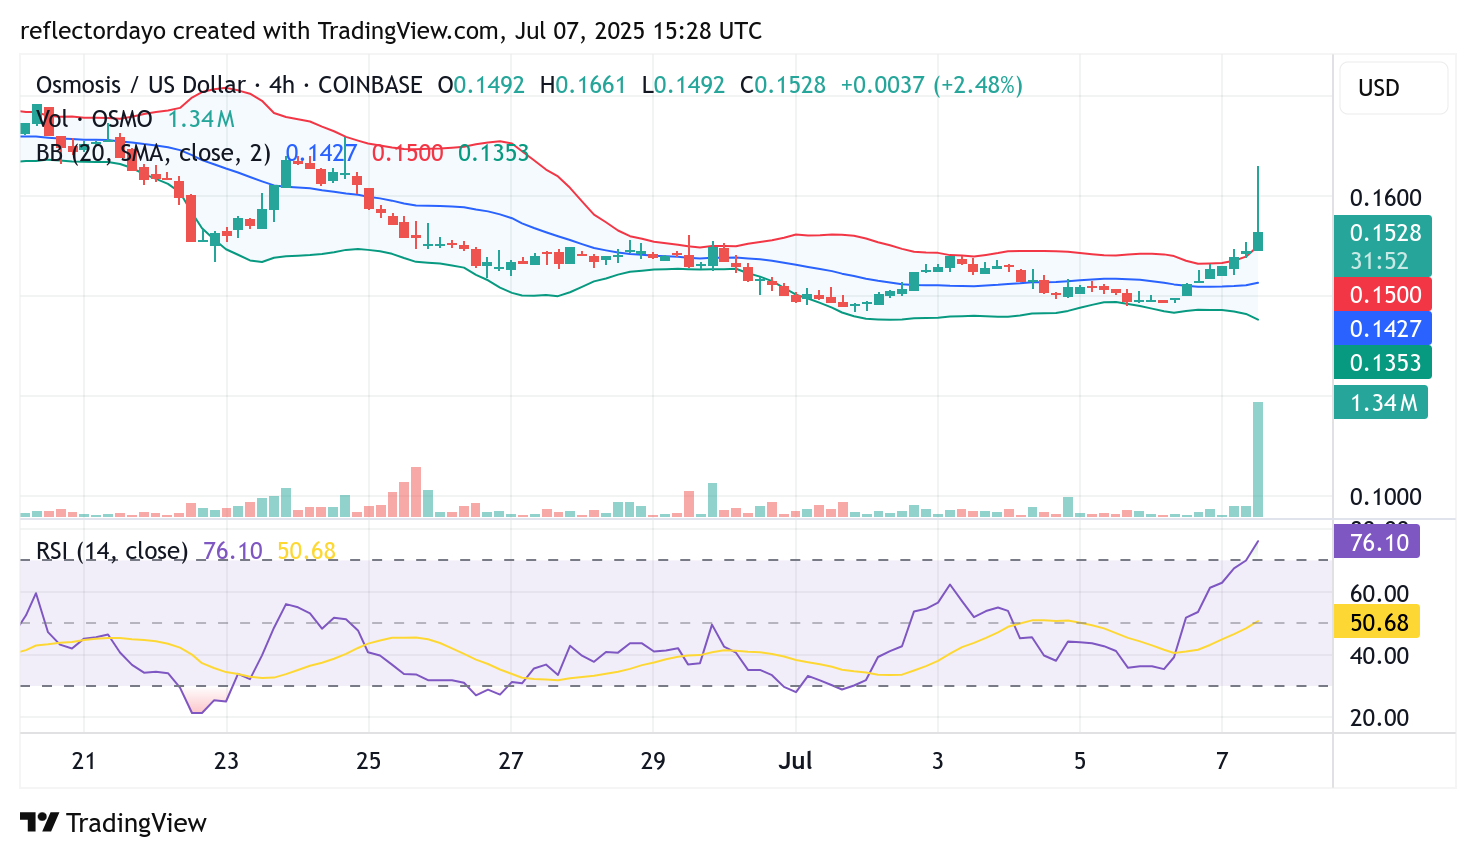
OSMO/USD 4-Hour Chart: Bulls Show Strength Amid Ongoing Bearish Overhang
While the daily chart still places the Osmosis (OSMO/USD) market within a broader bearish context, shorter timeframes are beginning to reflect a shift in momentum. On the 4-hour chart, bullish activity has gained notable traction, with the Relative Strength Index (RSI) surging above the 70 level, signaling strong buying pressure.
This spike in the RSI indicates that, despite the prevailing bearish sentiment on the higher timeframe, bulls have made a convincing push during the recent sessions. The price is now hovering around the $0.153 level—a zone that could serve as a foundation for further bullish continuation if supported by sustained buying interest.
Although caution is still warranted due to lingering overhead resistance and the larger downtrend structure, the current 4-hour setup suggests that short-term bullish momentum is building. A successful hold above $0.153 could reinforce this trend and open the door for a continued recovery.