Akash Network (AKT/USD) Bearish Momentum Stalls at Key $1.00 Support
Estimated Reading Time: 3 minutes
Don’t invest unless you’re prepared to lose all the money you invest. This is a high-risk investment and you are unlikely to be protected if something goes wrong. Take 2 minutes to learn more

Akash Network (AKT/USD) has experienced a steady downtrend since reaching a peak near $2.00 in May. This downward movement persisted until the price touched the critical $1.00 support level, a psychologically significant zone that quickly attracted renewed trader interest and helped halt the decline.
Following this support test, the market began to hover around the $1.00 level, suggesting a pause in bearish momentum. In today’s session, a modest bullish bounce lifted the price toward the 20-day moving average, currently positioned at approximately $1.085, signaling a potential shift in short-term sentiment.
Akash Network (AKT/USD) Market Data
AKT/USD Price Now: $1.100
AKT/USD Market Cap: $273 million
AKT/USD Circulating Supply: 248.3 million AKT
AKT/USD Total Supply: 3.885 million AKT
AKT/USD CoinMarketCap Ranking: #153
Key Levels
- Resistance: $1.50, $2.00, and $2.50
- Support: $1.00, $0.90, and $0.80
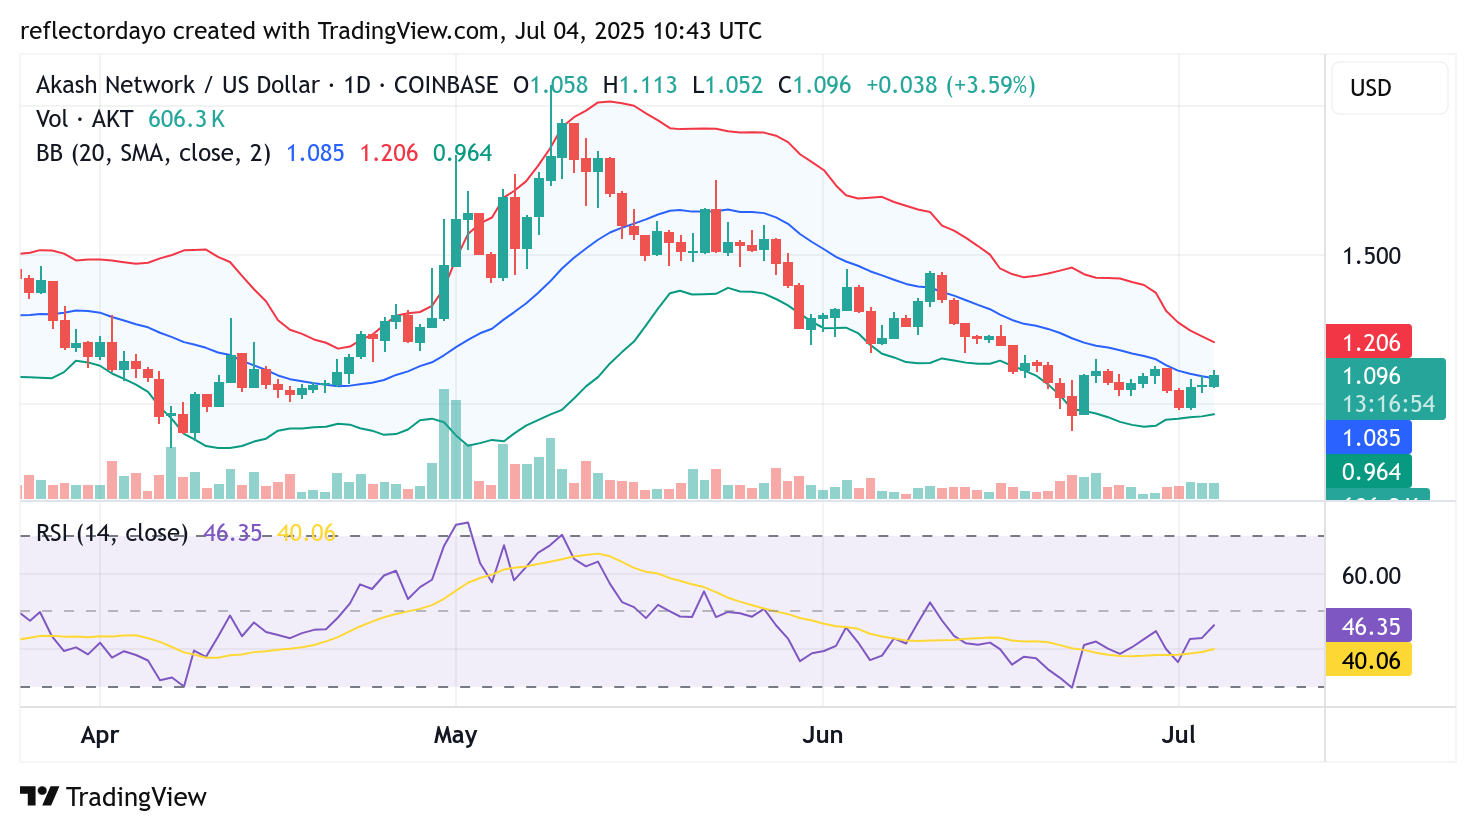
Akash Network (AKT/USD) Daily Chart Outlook: Consolidation Builds at $1.00 as Bulls Show Signs of Life
The daily chart for Akash Network (AKT/USD) continues to reflect a broader bearish bias, with the Bollinger Bands illustrating a prevailing downward trend. However, a shift in momentum may be emerging as the price action stalls and consolidates near the $1.00 support level, following multiple rejections of bearish attempts to push prices lower.
Notably, the lower Bollinger Band has started to tilt upward, in contrast to the direction of both the upper band and the 20-day moving average. This divergence signals early signs of bullish activity, suggesting that buyers are beginning to establish a presence at this key support.
As a result, price action has remained above the $1.00 mark, forming a base of consolidation. However, for a confirmed bullish reversal or trend shift, the market must break above the $1.12 resistance level. Until such a move materializes, continued sideways trading is likely, as the market seeks clarity and direction.
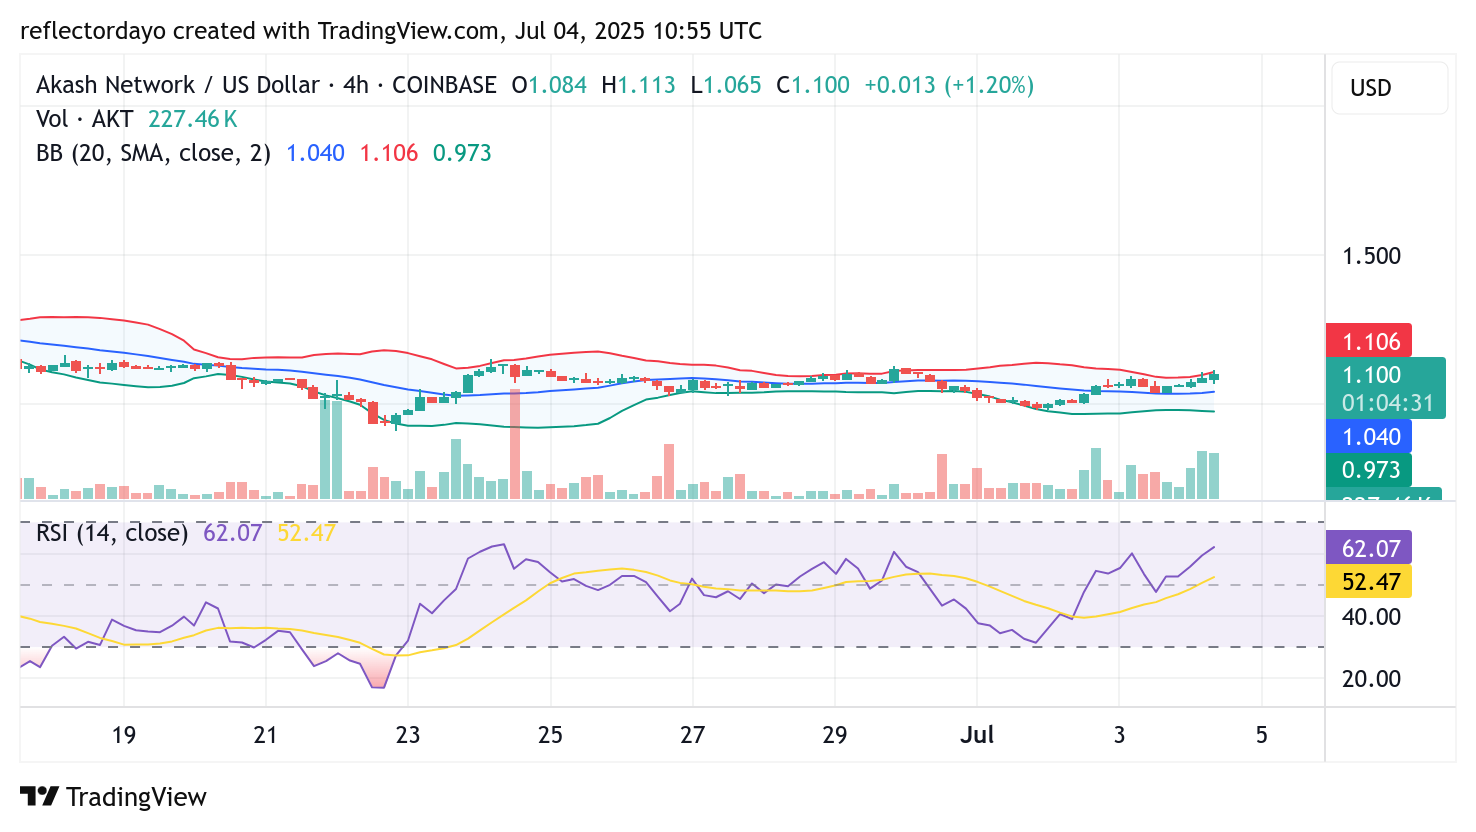
AKT/USD 4-Hour Chart: Bulls Attempt to Regain Control Amid Lingering Bearish Pressure
From the 4-hour chart perspective, the Akash Network (AKT/USD) market shows bulls making a cautious attempt to push the price higher. A series of bullish candlesticks highlights this upward effort; however, their relatively small size suggests hesitation or resistance in the move.
Interestingly, the trading volume histogram is showing notable activity, indicating that buyers are actively participating, even as bearish sentiment still lingers. This discrepancy between volume and candle size reflects the ongoing struggle between bulls and the remaining bearish momentum in the market.
If buyers can continue to absorb selling pressure and build momentum, a clearer breakout to the upside may follow. However, failure to maintain this effort could lead to a renewed breakdown below current support levels.