Ethereum (ETH/USD) Price Keeps Bullish Path
Estimated Reading Time: 3 minutes
Don’t invest unless you’re prepared to lose all the money you invest. This is a high-risk investment and you are unlikely to be protected if something goes wrong. Take 2 minutes to learn more
Ethereum Price Prediction – August 2
The ETH/USD price keeps bullish path to trade around a higher trading level of around $2,556. The percentage rate stands around $1.19 increases.
ETH/USD Market
Key Levels:
Resistance levels: $2,800, $3,200, $3,600
Support levels: $2,200, $2,000, $1,800
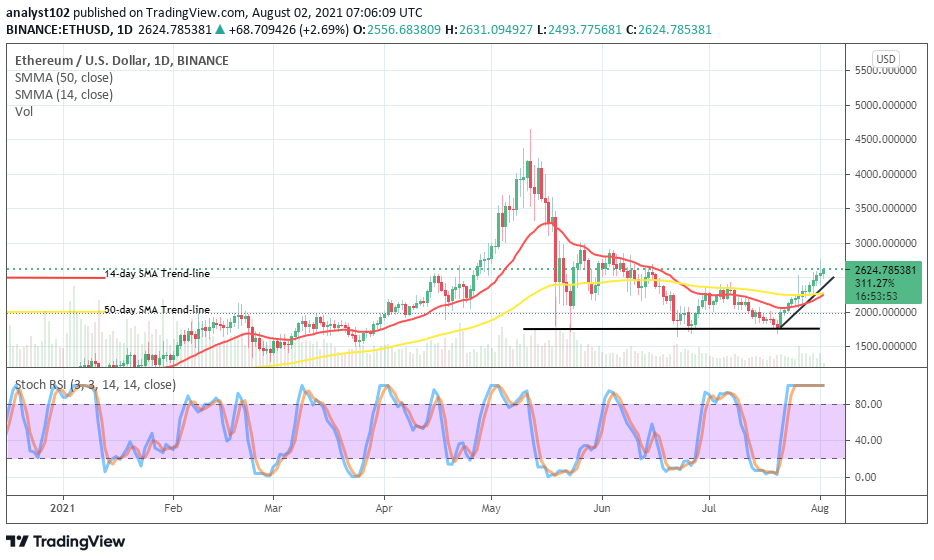
ETH/USD – Daily Chart
The ETH/USD daily trading chart depicts that the crypto’s price keeps bullish path to denote that variant buying forces prevailing over some of the other previous selling pressures in the market presently. The 50-day SMA trend-line has been touched by the 14-day SMA trend-line from underneath. The bullish trend-line drew northward across the SMAs to showcase the path that the crypto maintains. The Stochastic Oscillators are in the overbought region with their two lines conjoined, denoting a consolidation moving pattern. That suggests that the pressure to the upside is somewhat holding firm in the crypto economy.
As price keeps a bullish path, will the ETH/USD market appreciate further close to $2,800?
The ETH/USD market’s capacity approaching the immediate resistance level at $2,800 isn’t probably achievable in the near time as the price keeps bullish path. Bulls’ strength now pushes between $2,400 and $2,800 values. They may better be getting supports around the lower value line to keep afloat in higher values at the expense of bears’ weaknesses. A breakout of the upper value’s point may not achieve sustainability.
On the downside, the ETH/USD market bears have to position around the level of $2,600 to see where there’ll be a reversal of a sudden upward force around it before considering a sell order. A heavy upward reversal against the point of $2,400 will most likely lead back the crypto market to begin to see more downs again. A successful interception of the bigger SMA trend-line from underneath by the smaller SMA trend-line may signal a tight trading situation against a decent entry for a sell order.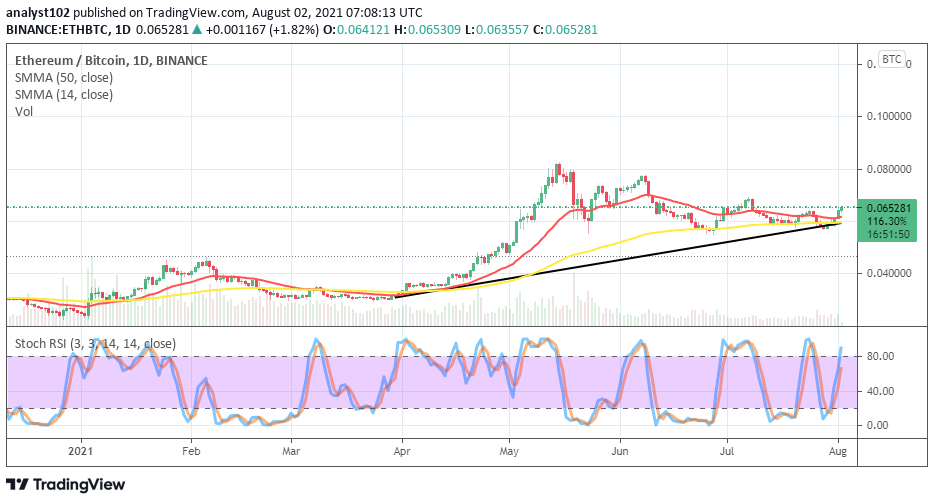
ETH/BTC Price Analysis
The trending weight between ETH and BTC on the price analysis chart shows that price keeps a bullish motion. In other words, the base crypto is moving slowly and steadily to the north. The 14-day SMA indicator is closely over the 50-day SMA indicator as they both slightly point north-east direction. The bullish trend-line drew underneath the bigger SMA in a supportive posture. The Stochastic Oscillators have briefly swerved northbound into the overbought region to signal that fake-upside pressure may soon be in the near time.
Note: Cryptosignals.org is not a financial advisor. Do your research before investing your funds in any financial asset or presented product or event. We are not responsible for your investing results.
You can purchase crypto coins here. Buy Tokens