BNB Remains Stable as It Falls to a Probable Low of $230
Estimated Reading Time: 2 minutes
Don’t invest unless you’re prepared to lose all the money you invest. This is a high-risk investment and you are unlikely to be protected if something goes wrong. Take 2 minutes to learn more
BNB (BNB) Long-Term Analysis: Ranging
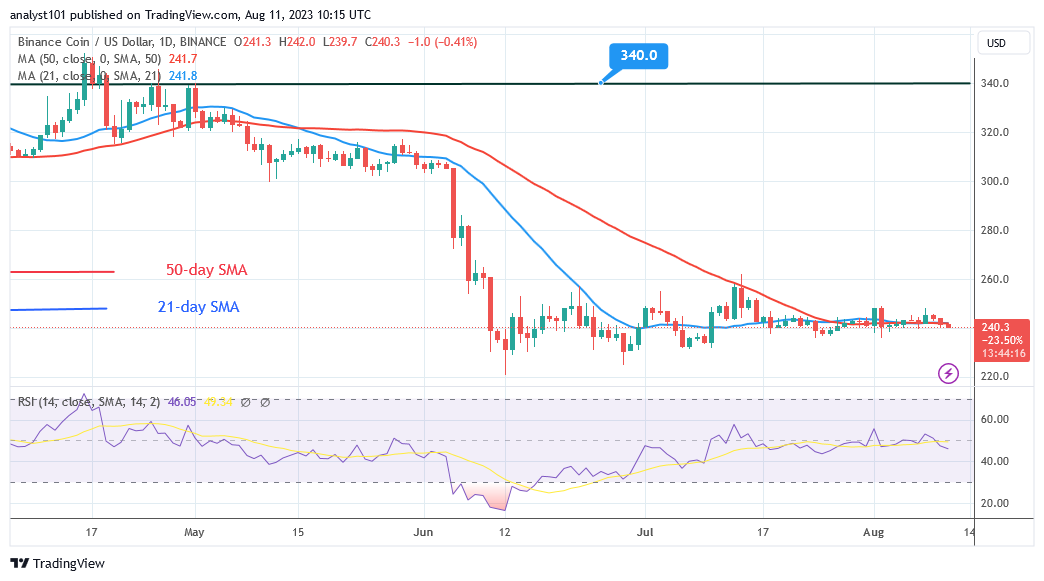
BNB (BNB) price is moving horizontally as it falls to a probable low of $230. The cryptocurrency’s price is currently below the moving average lines after being turned down twice at the $248 high. The altcoin is expected to decline even more as a result of the most recent upward correction.
At the time of writing, BNB has reached a low of $240.10. Doji candlesticks are present, therefore price movement is currently mild. Buyers and sellers are split on the market’s direction. Meanwhile, the altcoin is falling, with a possible low of $230.
Technical indicators:
Major Resistance Levels – $440, $460, $480
Major Support Levels – $240, $220, $200
Binance Coin (BNB) Indicator Analysis
The crypto’s price has held steady at level 45 of the Relative Strength Index for period 14. As the price bars fall below the moving average lines, BNB may fall. Following the rejection at the latest high, the altcoin is still in a bearish trend. BNB has previously touched the market’s oversold zone. The coin is falling back to the prior low.
What Is the Next Direction for Binance Coin (BNB)?
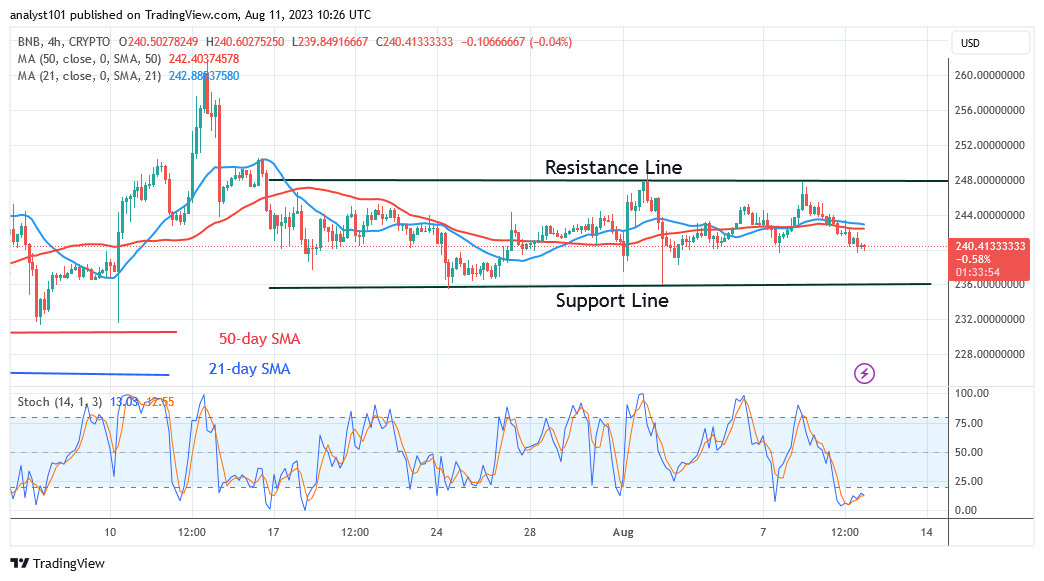
On the 4-hour chart, BNB is trading in a range between $236 and $248 as it falls to a probable low of $230. Currently, the altcoin’s price range is limited to a small range of $220 to $248. The altcoin has reached bearish exhaustion and is trading at the chart’s bottom.
You can purchase crypto coins here. Buy LBLOCK
Note: Cryptosignals.org is not a financial advisor. Do your research before investing your funds in any financial asset or presented product or event. We are not responsible for your investing results