Cardano’s Range Continues as It Remains above $0.38
Estimated Reading Time: 2 minutes
Don’t invest unless you’re prepared to lose all the money you invest. This is a high-risk investment and you are unlikely to be protected if something goes wrong. Take 2 minutes to learn more

Cardano (ADA) Price Long-Term Forecast: Bullish
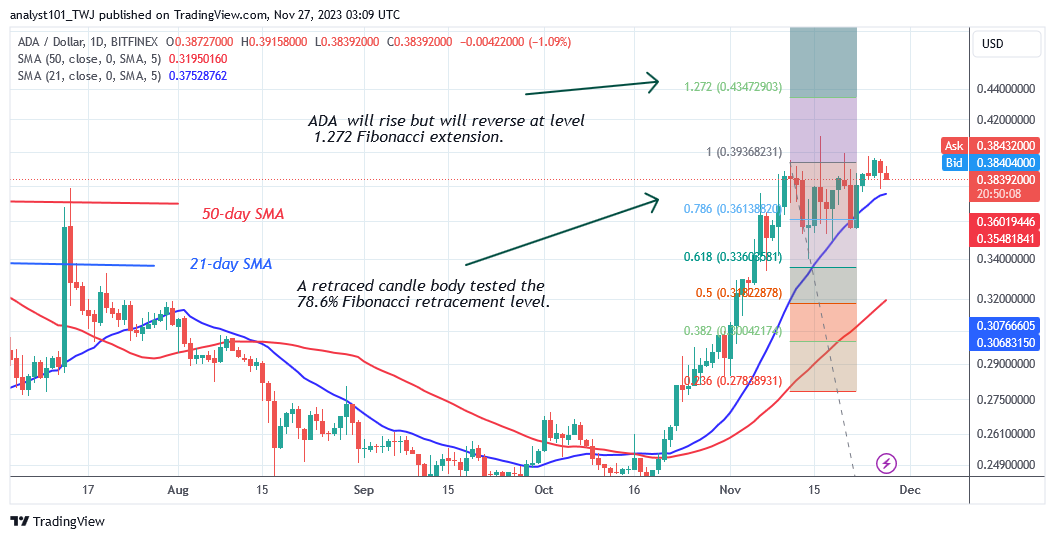
Cardano’s (ADA) price is trading above the moving average lines as it remains above $0.38. However, the uptrend has come to an end at the high of $0.39, resulting in a sideways move above the moving average lines. For more than two weeks, the cryptocurrency has been stuck in a price range between $0.35 and $0.40.
The bulls retested the $0.40 resistance zone on November 25. The altcoin’s price is falling to or above the moving average lines. If the bears breach the 21-day SMA and the bearish momentum continues, Cardano may resume selling pressure. The market will fall and reach a low of $0.32. If ADA/USD retraces above the moving average lines, the present range may be maintained.
Technical Indicators:
Major supply zones: $1.0, $1.05, $1.10
Major demand zones: $0.25, $0.20, $0.15
Cardano (ADA) Indicator Analysis
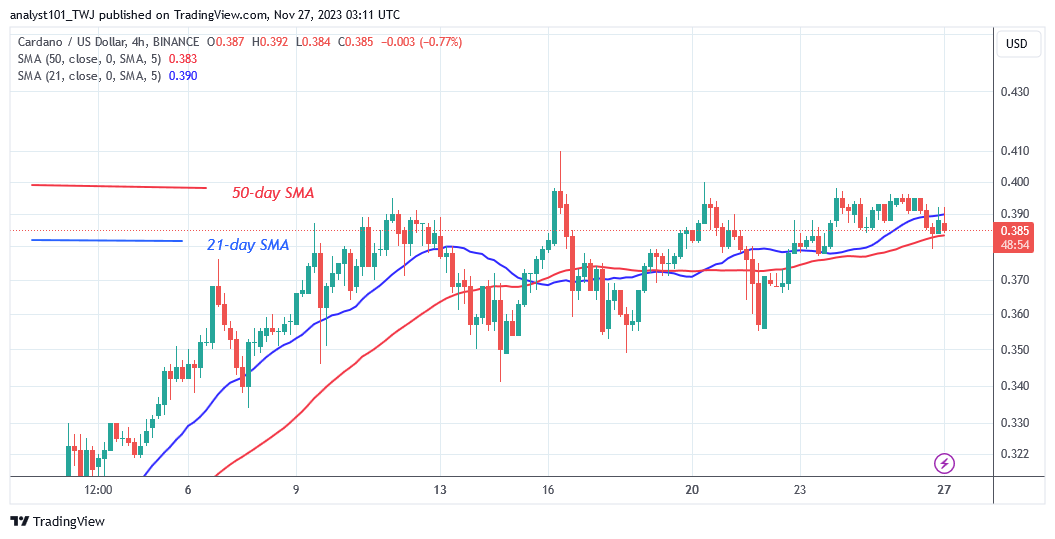
The sloping moving average lines on the 4-hour chart indicate that Cardano is in a range. The price bars have slanted above and below the moving average lines, indicating a sideways trend. The positive trend is still visible on the daily chart, as price bars continue above the moving average lines.
What Is the Next Move for Cardano (ADA)?
Cardano continues to trade above the moving average lines as it remains above $0.38. Today, the altcoin is retracing as it approaches the 21-day simple moving average. The price of cryptocurrency remains above the moving average lines. The current volatility is expected to continue.
You can purchase crypto coins here. Buy LBLOCK
Note: Cryptosignals.org is not a financial advisor. Do your research before investing your funds in any financial asset or presented product or event. We are not responsible for your investing results