Arbitrum(ARB) Price Looks for $1 Support: Is That Possible?
Estimated Reading Time: 3 minutes
Don’t invest unless you’re prepared to lose all the money you invest. This is a high-risk investment and you are unlikely to be protected if something goes wrong. Take 2 minutes to learn more

The price of Arbitrum’s token ARB dropped to a low of $0.90 on April 13, marking a 60% decline from its all-time high of $2.20 on March 9.
Despite closing above $1 on April 13 and rebounding to a high of $1.22 on April 22, ARB’s price experienced another decline, returning to the $1 mark.
This situation suggests that sellers may be exerting pressure, raising the question of whether ARB can maintain its current support level. At press time, Arbitrum trades at $1.0500
ARB/USD Long-term Trend: Bearish (Daily Chart)
Key levels:
Resistance Levels: $1.0600, $1.0800, $1.1000
Support Levels: $1.0400, $1.0200, $1.0000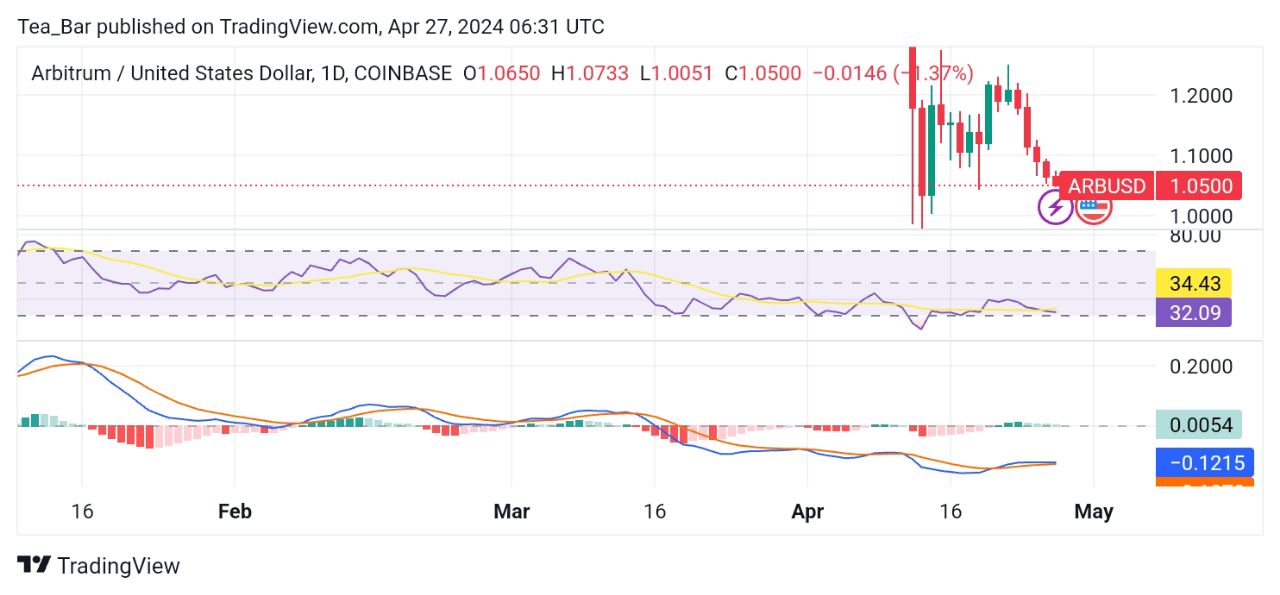
The daily chart shows that the RSI is indicating oversold conditions, suggesting a potential recovery. However, it seems to be brief as the price is pushed down again due to a rejection near the descending resistance.
The Moving Average Convergence Divergence (MACD) indicator shows a bearish market trend, with the MACD line crossing below the signal line.
This bearish crossover is confirmed by the MACD value being under 0 and the presence of red bars beneath the line.
ARBUSD Medium-term Trend: Bearish (4H Chart)
Arbitrum is trading at $1.0500 on the 4-hour chart. The Relative Strength Index (RSI) is at 24.95, indicating oversold conditions and suggesting a potential bounce. 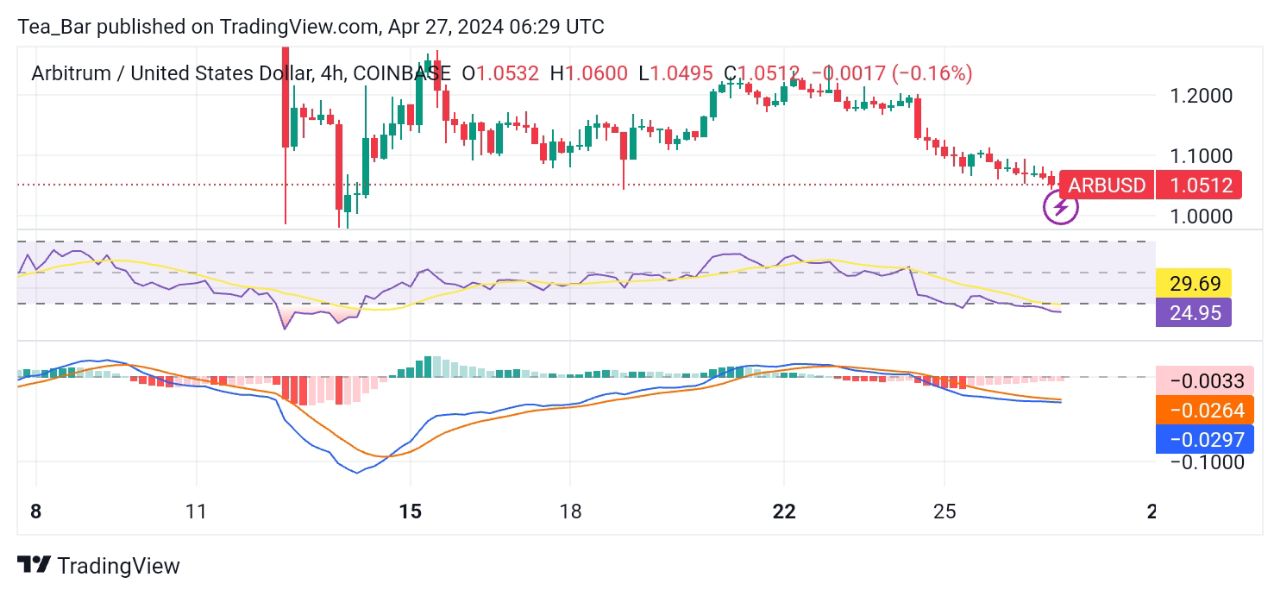
However, the Moving Average Convergence Divergence (MACD) is at -0.0297, pointing to a bearish trend. The nearest resistance level is at $1.0600, which could limit upward movement.
On the downside, support is at $1.0000, acting as a potential buffer against further declines. Traders should keep an eye on these levels for potential reversals or trend continuations.
Will Arbitrum Stay Above $1?
Arbitrum is at a pivotal moment, testing whether it can hold above the $1 level. The 4-hour chart reveals oversold conditions, suggesting a potential rebound.
However, the bearish trend indicated by the MACD, combined with ongoing downward pressure, creates uncertainty. The support at $1 serves as a possible floor, but sustained selling could lead to a break below this level.
Traders should monitor the situation closely for signs of a reversal or further downward movement. The outcome will depend on whether the support holds firm or the bears take control.
Place winning Arbitrum trades with us. Get ARB here.