Arbitrum (ARB) Fights for Recovery After Hitting $0.8556 Low
Estimated Reading Time: 2 minutes
Don’t invest unless you’re prepared to lose all the money you invest. This is a high-risk investment and you are unlikely to be protected if something goes wrong. Take 2 minutes to learn more
Arbitrum (ARB)Price Prediction- April 16
The price of Arbitrum experienced an attempted rebound on Sunday, spurred by a drop to $0.85 the previous day. However, this recovery proved premature, meeting formidable resistance as traders sought to exit positions to mitigate liquidity concerns, thereby amplifying the looming downside risk.
Currently trading at $1.1319, the situation underscores the challenges faced by the market, highlighting the delicate balance between recovery efforts and the persistent threat of further decline amidst prevailing uncertainties.
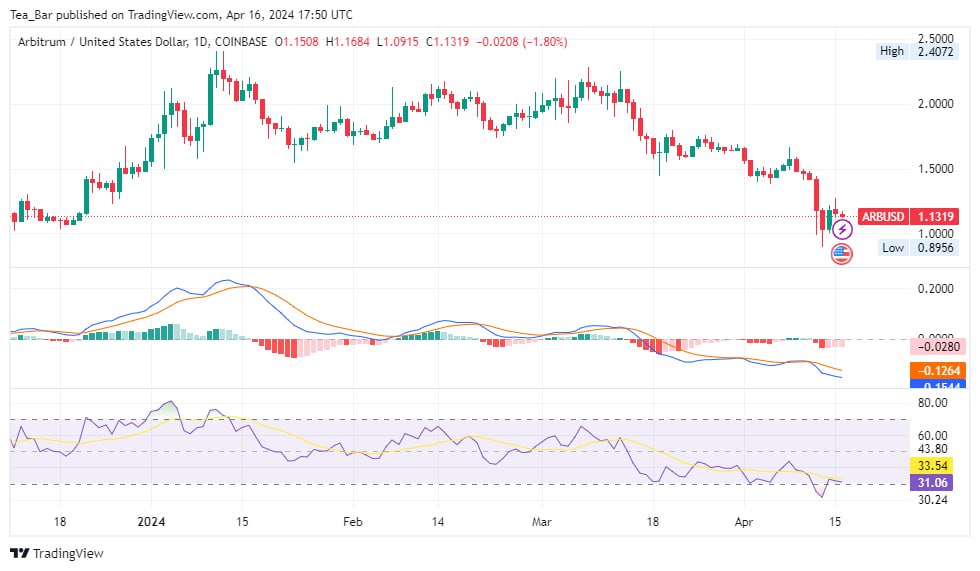
ARB/USD Long-term Trend: Bearish (Daily Chart)
Key levels:
Resistance Levels: $1.1500, $2.0000, $2.2500
Support Levels: $1.1000, $1.0500, $1.0000
As can be seen from the daily chart, the Arbitrum price is going further below. The Moving Average Convergence Divergence (MACD) indicator is signaling a bearish market trend as the MACD line has crossed beneath the signal line, indicating a bearish crossover, with the MACD value residing below 0.
Additionally, the Relative Strength Index (RSI) is situated in a bearish zone, registering a value of 31.06, further confirming the prevailing bearish sentiment.
ARBUSD Medium-term Trend: Bullish (4H Chart)
In this period of market analysis, the signs are pointing towards a buoyant atmosphere ripe with opportunity. The MACD’s bullish inclination is not just a mere trend, but a beacon of optimism, with its steady convergence towards the signal line and the uplifting transition of red bars to green in the histogram. 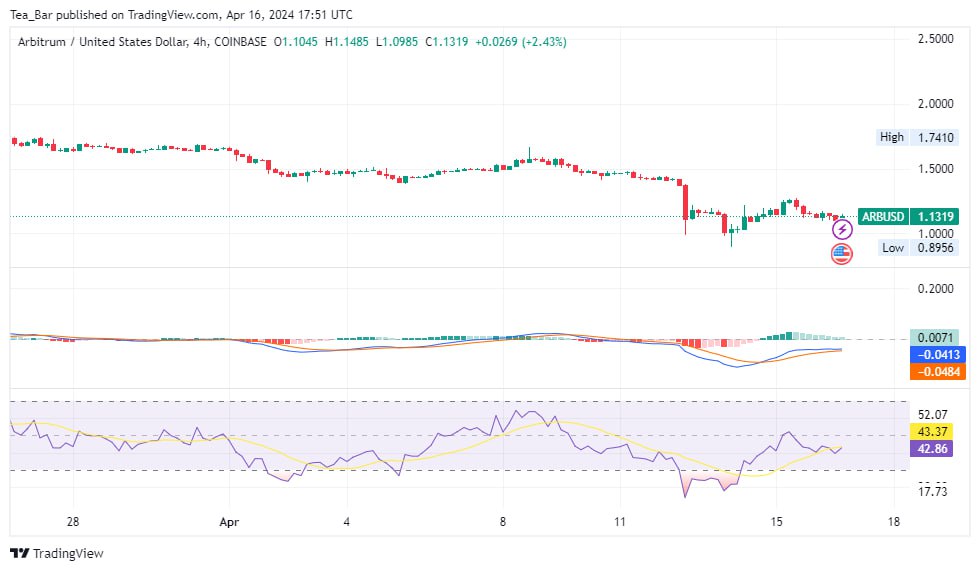
Furthermore, the ascending trajectory of the RSI, currently hovering at a promising 42.86 level, hints at an impending surge in bullish sentiment, potentially pushing the market into overbought territory.
This confluence of indicators isn’t just a coincidence; it’s a testament to the resilience and dynamism of the market. Investors can take heart in these positive signals, knowing that they’re riding a wave of potential prosperity and growth.
Place winning Arbitrum trades with us. Get ARB here.