Arbitrum Price Prediction: ARB/USD Get Ready for the Top; More Buyers Are Expected
Estimated Reading Time: 3 minutes
Don’t invest unless you’re prepared to lose all the money you invest. This is a high-risk investment and you are unlikely to be protected if something goes wrong. Take 2 minutes to learn more
Arbitrum Price Prediction – April 8
The Arbitrum price prediction shows that ARB will recover to the upside as the coin gets ready for a cross above the 9-day and 21-day moving averages.
ARB/USD Long-term Trend: Ranging (1D Chart)
Key Levels:
Resistance levels: $2.00, $2.05, $2.10
Support levels: $1.15, $1.10, $1.05
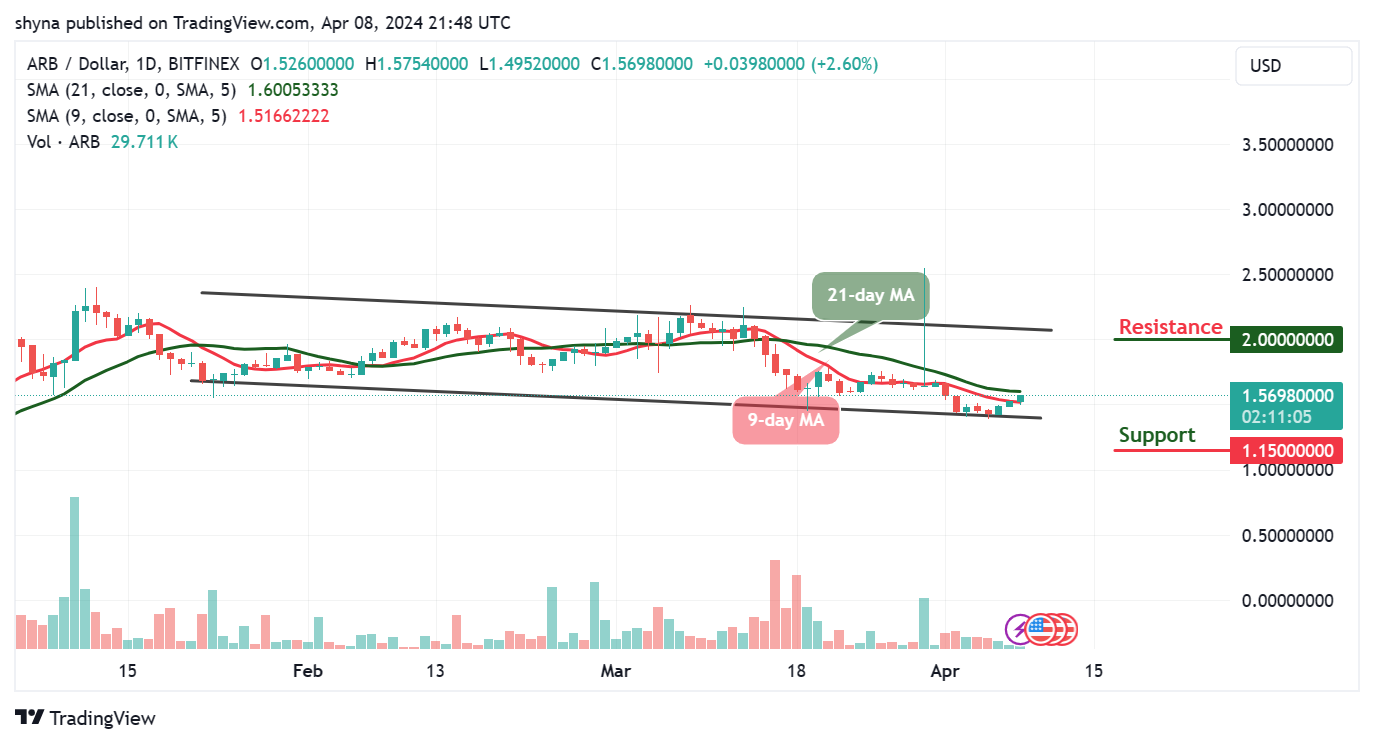
ARB/USD is ranging at the moment as the market price hovers within the 9-day and 21-day moving averages. Meanwhile, the market could become low so that new and existing buyers could come into the market. Meanwhile, if the bulls fail to push the price to the upside, the Arbitrum price may continue to range before gaining the upside.
Arbitrum Price Prediction: ARB/USD Would Move Higher
According to the daily chart, the Arbitrum price will break toward the upper boundary of the channel if the bulls push and keep the coin above the 9-day and 21-day moving averages. Therefore, any further bullish movement above this barrier could hit the potential resistance levels of $2.00, $2.05, and $2.10.
Moreover, the upward movement could be delayed if the sellers slide the lower boundary of the channel; the market price could slide to touch the support levels of $1.15, $1.10, and $1.05. Nonetheless, the 9-day moving average is likely to make a bullish cross above the 21-day moving average, which could suggest a bullish movement.
ARB/USD Medium-term Trend: Ranging(4H Chart)
According to the 4-chart, the Arbitrum price is consolidating within the channel. The coin is preparing to head to the upside if the major resistance level of $1.60 could be located. However, if the buyers push the price above the upper boundary of the channel, potential resistance could be located at $1.75 and above.
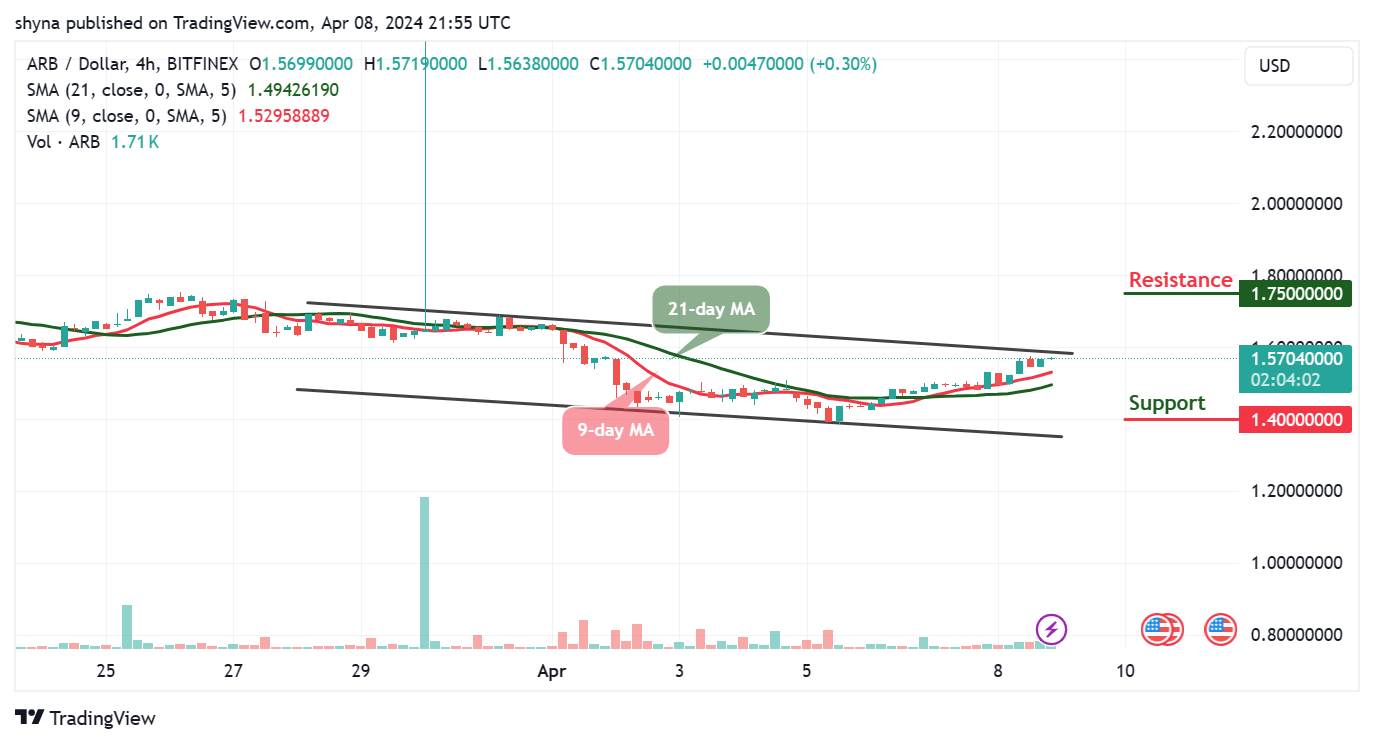
Meanwhile, the 9-day MA remains above the 21-day MA, indicating that the bulls are building momentum. Therefore, should the bulls fail to move the current market value to the upside, the ARB price could slide a little, and the nearest support level could be found at $1.40 and below.
Place winning Arbitrum trades with us. Get ARB here