Arbitrum Price Prediction: ARB/USD May Reclaim $2.18 Resistance
Estimated Reading Time: 3 minutes
Don’t invest unless you’re prepared to lose all the money you invest. This is a high-risk investment and you are unlikely to be protected if something goes wrong. Take 2 minutes to learn more
Arbitrum Price Prediction – March 3
The Arbitrum price prediction indicates potential upward movement for ARB, as the coin maintains its position near the $2.08 mark.
ARB/USD Long-term Trend: Ranging (1D Chart)
Key Levels:
Resistance levels: $2.70, $2.75, $2.80
Support levels: $1.45, $1.40, $1.35
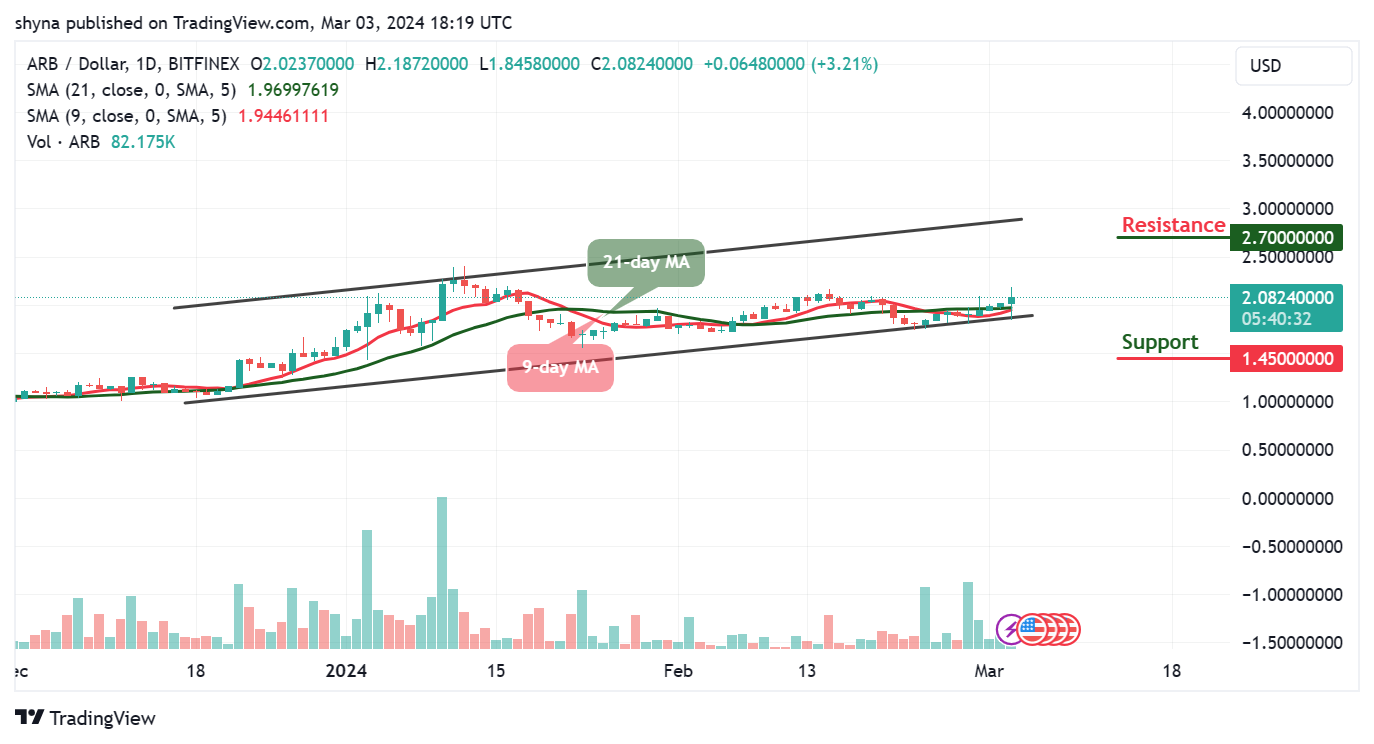
Analyzing the daily chart, it appears that ARB/USD is poised to ascend toward the upper boundary of the channel, potentially reaching the $2.50 resistance level in the next bullish movement. The Arbitrum price might experience sideways movement before focusing on an upward trajectory. Presently, ARB/USD is trading at $2.08, with a possibility of approaching the nearest resistance at $2.20 should bullish pressure intensify.
Arbitrum Price Prediction: ARB Price Could Move to the North
The Arbitrum price maintains its position above both the 9-day and 21-day moving averages, indicating a positive trend. Should this bullish momentum persist, it could attract more buyers, potentially propelling the price towards resistance levels at $2.70, $2.75, and $2.80. Conversely, a decline below the lower boundary of the channel may empower sellers, with the nearest support at $1.80 becoming a focal point.
Furthermore, breaching the 21-day moving average may intensify downside pressure, with potential support levels forming around $1.45, $1.40, and $1.35 respectively. The crossover of the 9-day moving average above the 21-day moving average may further bolster the coin’s positive trajectory.
ARB/USD Medium-term Trend: Bullish (4H Chart)
ARB/USD is currently maintaining its position above both the 9-day and 21-day moving averages, indicating potential for further bullish momentum. However, a decisive close above the $2.10 resistance level is needed to bolster bullish sentiment and propel prices toward the $2.15 resistance level and beyond.

On the flip side, a bearish reversal towards the lower channel boundary could trigger a market price reversal, potentially leading to a decline towards the $1.95 support level and below. Nevertheless, if the 9-day moving average continues to remain above the 21-day moving average, there remains a possibility of the Arbitrum price sustaining its upward trajectory.
Place winning Arbitrum trades with us. Get ARB here