Arbitrum Price Prediction: ARB/USD Could Trade Above $1.80 Level
Estimated Reading Time: 3 minutes
Don’t invest unless you’re prepared to lose all the money you invest. This is a high-risk investment and you are unlikely to be protected if something goes wrong. Take 2 minutes to learn more
Arbitrum Price Prediction – February 5
The Arbitrum price prediction is consolidating, if the bulls increase their momentum, the price will shoot higher.
ARB/USD Long-term Trend: Ranging (Daily Chart)
Key Levels:
Resistance levels: $2.35, $2.45, $2.55
Support levels: $1.20, $1.10, $1.00
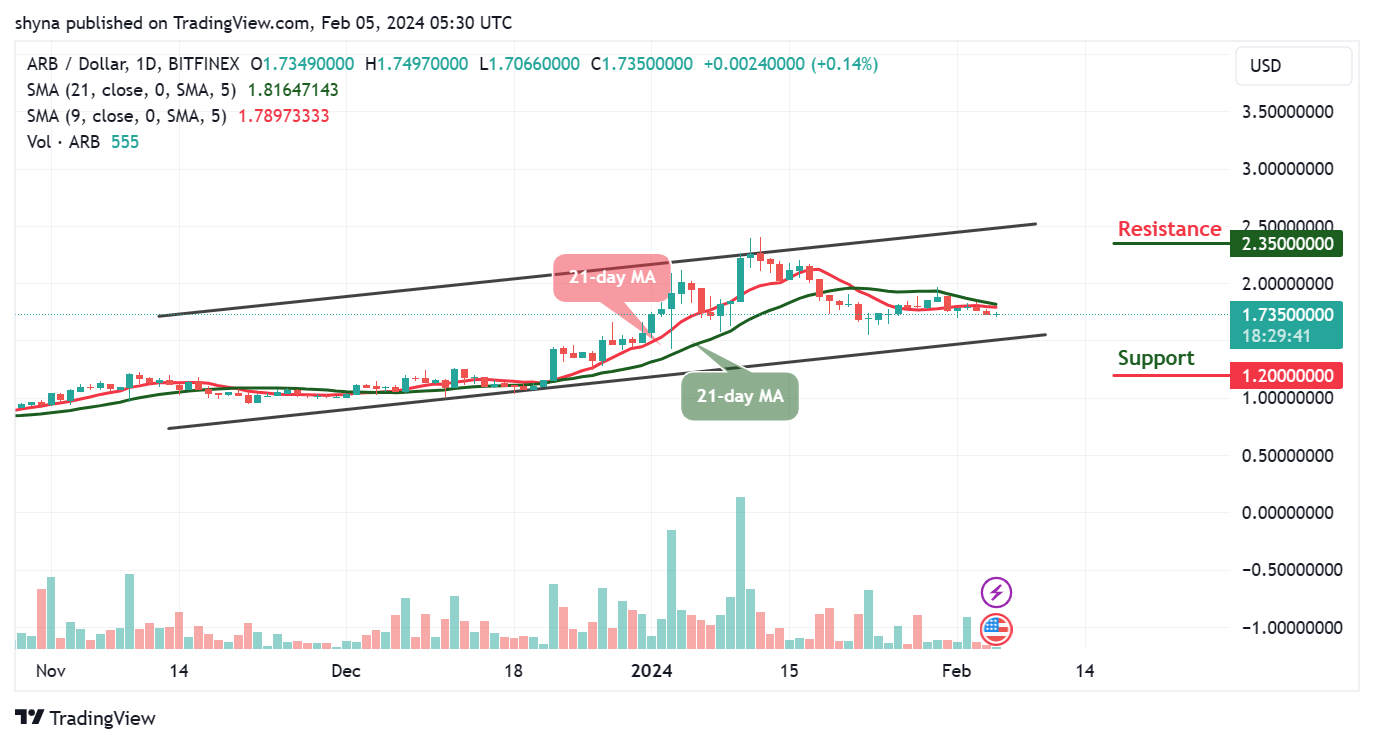
As ARB/USD advances, the coin is poised for an upward trajectory, potentially surpassing both the 9-day and 21-day moving averages. Should bullish momentum strengthen and breach the resistance at $1.80, expect a surge towards the upper boundary of the channel.
Arbitrum Price Prediction: ARB Will Spike to the Upside
Observing the chart, a surge in Arbitrum price, accompanied by bullish consolidation, could prompt significant upward correction. Conversely, heightened bearish activity may ensue, leading to further losses and creating opportunities for new buyers, with potential support levels identified at $1.20, $1.10, and $1.00 respectively.
Simultaneously, the Arbitrum price is poised to ascend, targeting the nearest resistance at $1.80. Continued bullish momentum could breach additional resistance levels at $2.35, $2.45, and $2.55. Furthermore, the 9-day moving average is anticipated to surpass the 21-day moving average, signaling bullish movement for the coin.
ARB/USD Medium-term Trend: Ranging (4H Chart)
Arbitrum (ARB) currently trades below both the 9-day and 21-day moving averages, indicating a potential upward surge. If the coin manages to breach the resistance level of $1.80, it could pave the way for further gains. In such a scenario, breaking toward the upper boundary of the channel might signify an uptrend, possibly leading to a touch of the resistance level at $1.95 and above.
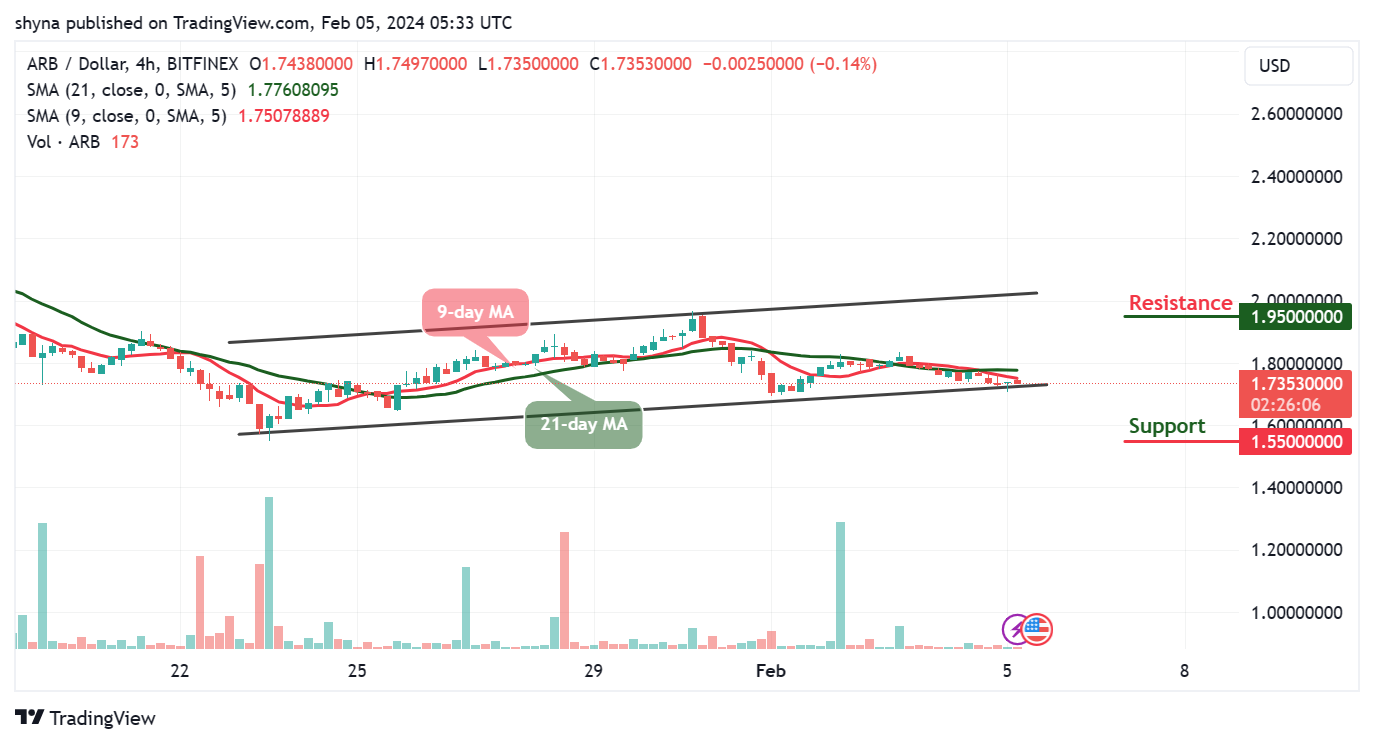
Conversely, a slight retreat may occur for ARB/USD if it breaches the lower boundary of the channel, potentially reaching the support level at $1.55 or below. Notably, the 9-day moving average lies beneath the 21-day moving average, indicating a bearish trend. However, any bullish crossover above these moving averages could propel the price toward the resistance level of $1.90.
Place winning Arbitrum trades with us. Get ARB here