Arbitrum Price Prediction: ARB/USD Nosedives Below $1.88
Estimated Reading Time: 3 minutes
Don’t invest unless you’re prepared to lose all the money you invest. This is a high-risk investment and you are unlikely to be protected if something goes wrong. Take 2 minutes to learn more
Arbitrum Price Prediction – January 31
The Arbitrum price prediction shows that ARB loses traction after touching the $1.88 level; losses are likely to play out.
ARB/USD Long-term Trend: Ranging (Daily Chart)
Key levels:
Resistance Levels: $2.50, $2.55, $2.60
Support Levels: $1.10, $1.05, $1.00
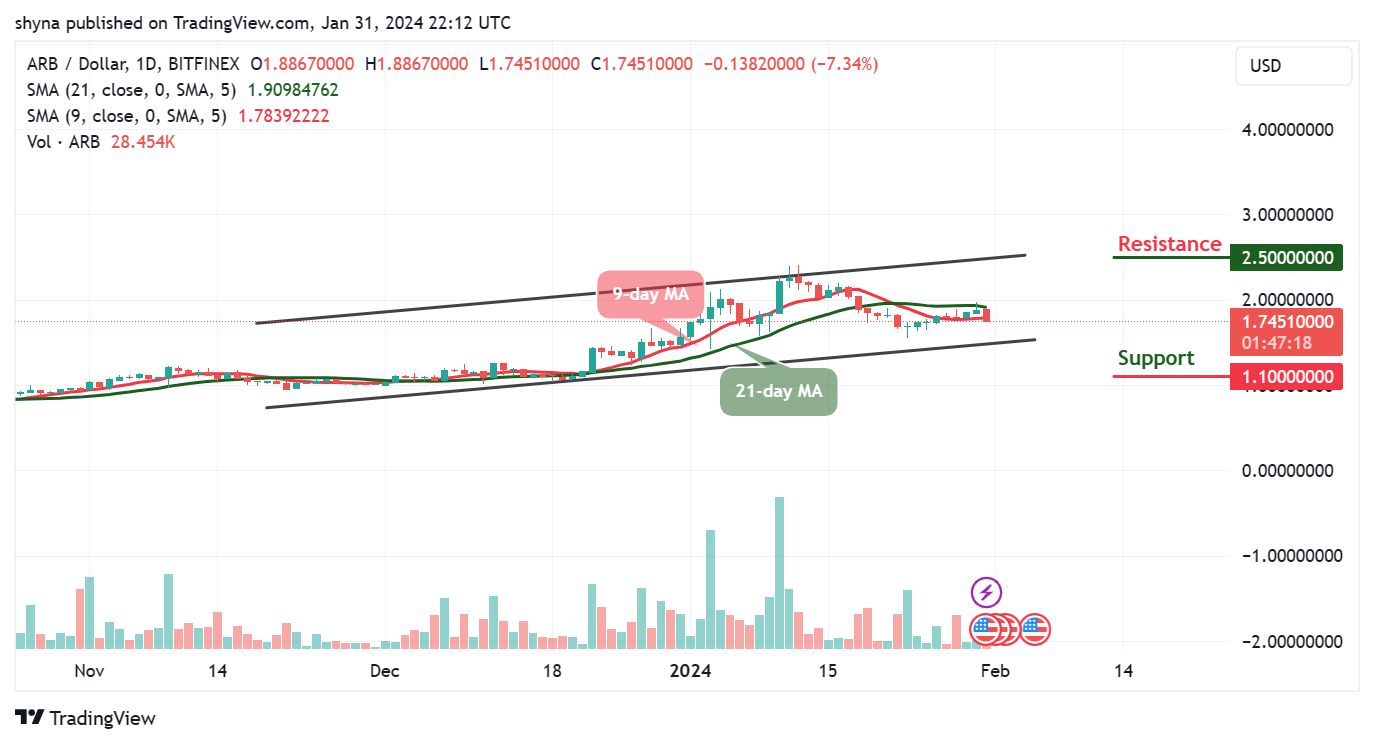
ARB/USD is retreating to cross below the 9-day moving average as the coin posts minor losses of 7.34% on the day after commencing trading at $1.88. However, the market movement has an intraday high of $1.88; although the crypto touches the support level of $1.74 where it is currently trading.
Arbitrum Price Prediction: The Arbitrum Price May Plunge More
The Arbitrum price may continue to follow the bearish movement, marking $1.74 as the current daily low at the moment. However, Arbitrum (ARB) could be searching for a new low by crossing below the 9-day moving average. Looking at the declining daily volume candle, together with the steady but stable recent Arbitrum price action, it can be assumed that a stronger move may be coming up soon into the market.
At the time of writing, ARB/USD is struggling to maintain the $1.88 level, and if the coin follows the downward trend as the 9-day moving average remains below the 21-day moving average, the next supports may come at $1.10, $1.05, and $1.00. On the contrary, if the coin crosses above the 21-day moving average, further movement could go above the upper boundary of the ascending channel to hit the resistance levels of $2.50, $2.55, and $2.60.
ARB/USD Medium-Term Trend: Ranging (4H Chart)
On the 4-hour chart, the Arbitrum price hovers below the 9-day and 21-day moving averages at $1.74 which may take time to persistently trade above $1.80. However, should the bulls gather enough strength and cross above the moving averages, the upward movement may come at the resistance level of $2.0 and above.
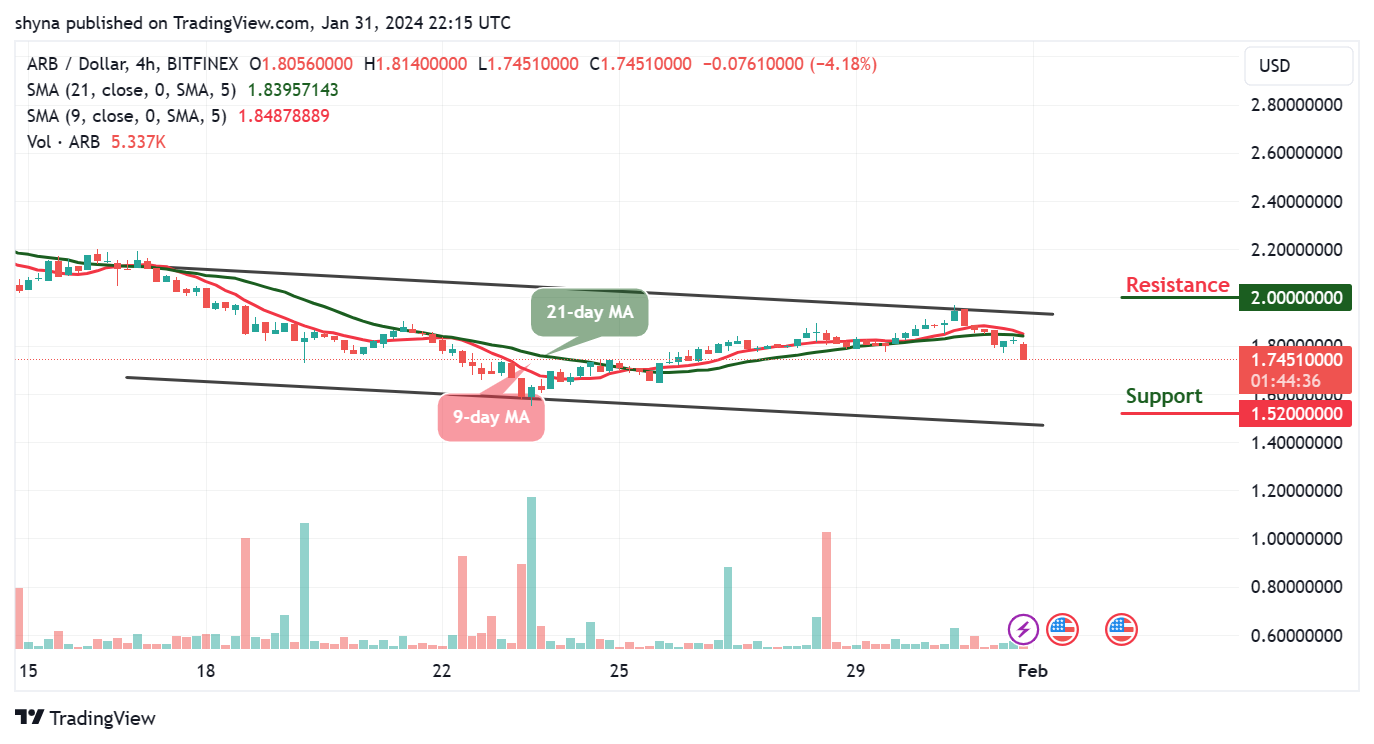
However, on the downside, immediate support is below the moving average while the main support is at the $1.55 level. The price may likely fall to the support level of $1.52 and below. Technically, the Arbitrum price is still moving sideways while the 9-day MA may cross below the 21-day MA, indicating a bearish movement.
Place winning Arbitrum trades with us. Get ARB here