Arbitrum Price Prediction: ARB/USD May Dive Below $2.0 Support
Estimated Reading Time: 3 minutes
Don’t invest unless you’re prepared to lose all the money you invest. This is a high-risk investment and you are unlikely to be protected if something goes wrong. Take 2 minutes to learn more
Arbitrum Price Prediction – January 13
The Arbitrum price failed to cross above the resistance level of $2.2. As a result, ARB could begin a fresh decline below the $2.0 support.
ARB/USD Long-term Trend: Bullish (Daily Chart)
Key levels:
Resistance Levels: $2.80, $3.00, $3.20
Support Levels: $1.60, $1.40, $1.20
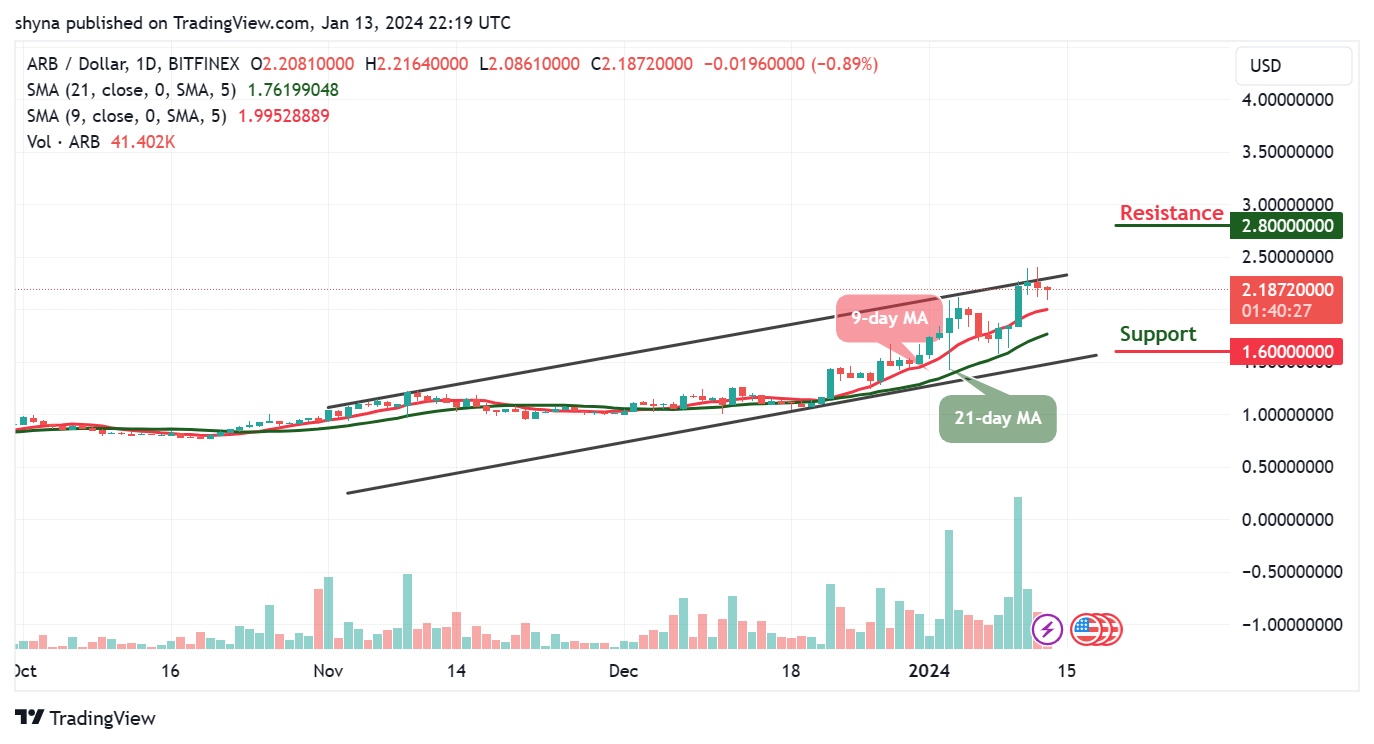
ARB/USD touches its daily lowest level at $2.08 as more selling pressure is likely to play out if the bulls fail to push the coin upward. Today’s trading session has seen the Arbitrum price heading to the south for the past few days. Therefore, the coin hit a low of $2.08 a couple of hours ago.
Arbitrum Price Prediction: ARB Price Could see a Further Drop
The Arbitrum price may continue to follow a bearish fever if the sellers increase the pressure. However, with the Arbitrum price heading toward the south, the coin may likely create another support at $1.80. Meanwhile, the crypto market may experience a serious downtrend if the 9-day moving average slides below the 21-day moving average. On the other hand, if the Arbitrum price crosses above the upper boundary of the channel, it may locate the potential resistance at $2.80, $3.00, and $3.20 levels.
Nevertheless, the Arbitrum price was rejected at the important level of $2.21, however, with $2.50 as the new psychological barrier to the bull run, any movement below it is a bear territory, and bulls will need to stay on their toes. However, if a deeper correction follows here, it could be considered extremely unhealthy for ARB/USD as the critical supports are located at $1.60, $1.40, and $1.20. Meanwhile, the 9-day moving average remains above the 21-day moving average, which could suggest that bulls may come into play.
ARB/USD Medium-term Trend: Ranging (4H Chart)
Looking at the 4-hour chart, the Arbitrum price is moving sideways and the coin may spike above the 9-day and 21-day moving average if the bulls increase the pressure. However, the 9-day moving average is seen crossing below the 21-day moving average and the Arbitrum price may likely slide toward the lower boundary of the channel and could reach the critical support at $1.70 and below.
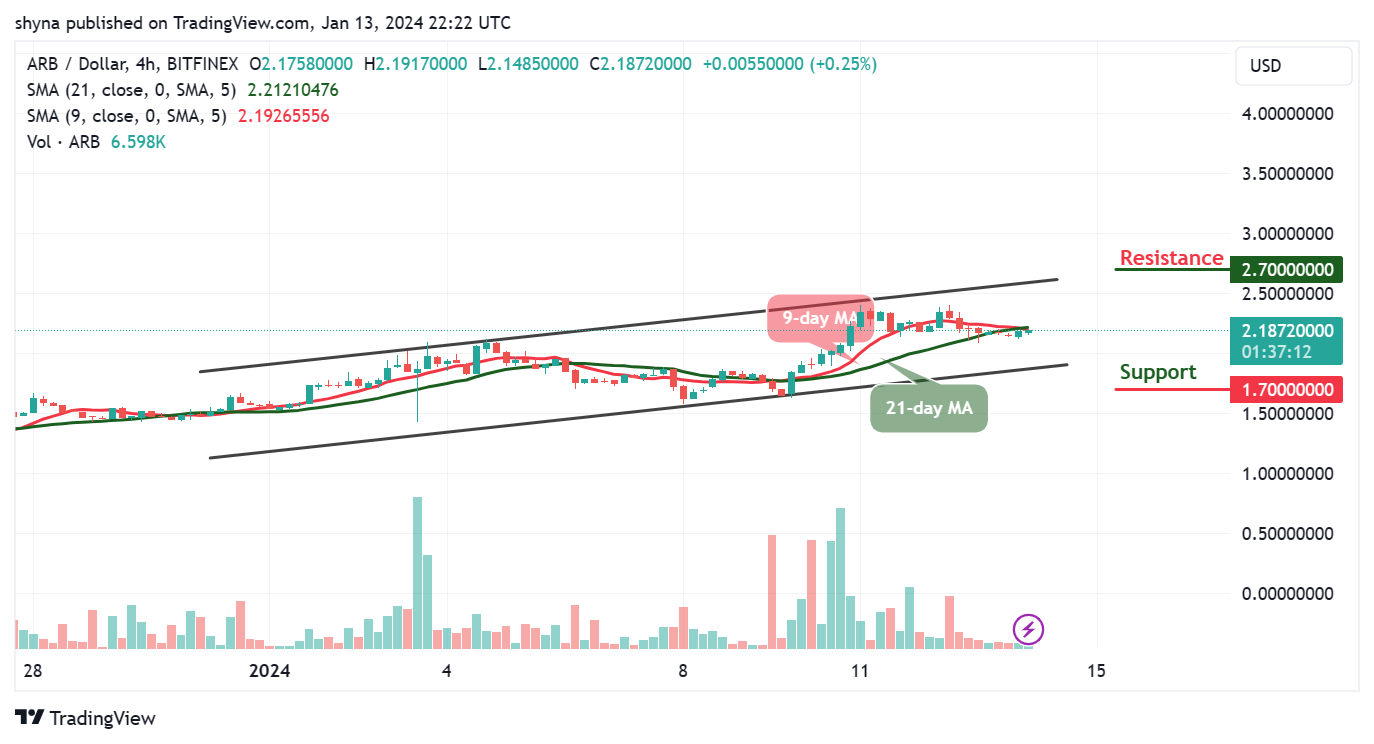
Meanwhile, if the bulls can hold the current price tight, ARB/USD may likely cross above the moving averages to face the upper boundary of the channel, crossing above this barrier could hit the potential resistance at $2.70 and above. The 9-day MA may need to stay above the 21-day MA so that more bullish signals could play out.
Place winning Arbitrum trades with us. Get ARB here