Bitcoin (BTC/USD) at Last Breaks out the Key Resistance of $60,000 Level
Estimated Reading Time: 3 minutes
Don’t invest unless you’re prepared to lose all the money you invest. This is a high-risk investment and you are unlikely to be protected if something goes wrong. Take 2 minutes to learn more
Bitcoin Price Prediction – April 14
The BTC/USD long-resistant trading line at $60,000 has finally broken northward while the crypto’s value is appreciated against the purchasing worth of the USD counter currency.
BTC/USD Market
Key Levels:
Resistance levels: $65,000, $70,000, $75,000
Support levels: $50,000, $45,000, $40,000
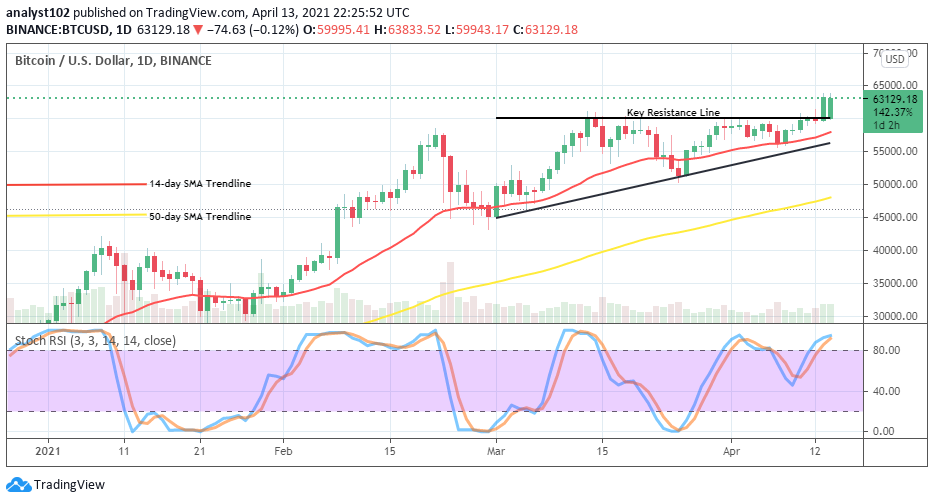
BTC/USD – Daily Chart
It has now been signified that the $60,000 long-lived resistant trading has breached by the formation of a bullish candle against the upper range line. That occurred after so much needed pressures hardened on the fiat countering the smooth upward run of the chief base trading instrument at that level. Yet, both the trend-lines of the bullish drawn-line and the 14-day SMA are of more pointing to the north below the current market’s price. The 50-day SMA trend-line has slightly shifted position upwardly to point towards the north close to the level of $50,000. The Stochastic Oscillators are in the overbought region attempting to close the hairs within it to probably signal a start of a consolidation move.
Will the current BTC/USD price breakout of the $60,000 resistance be sustained?
It is much prettier to nourish the belief that the BTC/USD bulls have now had a better edge to push for more ups as the strong resistance line has succumbed to pressures after a long time of trading days’ sessions. Being as it is, a downward revisit of the upper range line may put the starting of another bullish trend continuation to less-impulsive price actions.
As regards the possibility of witnessing a downward pressure in the crypto-trade, the bears having eventually lost the chance at the resistant trading level of $60,000 will need to be on the lookout for another higher level of the trade-resistant zone before considering an entry for sell position. And, that assumption may be forthcoming around the resistance of $70.000 and $75,000 after some days of trading sessions.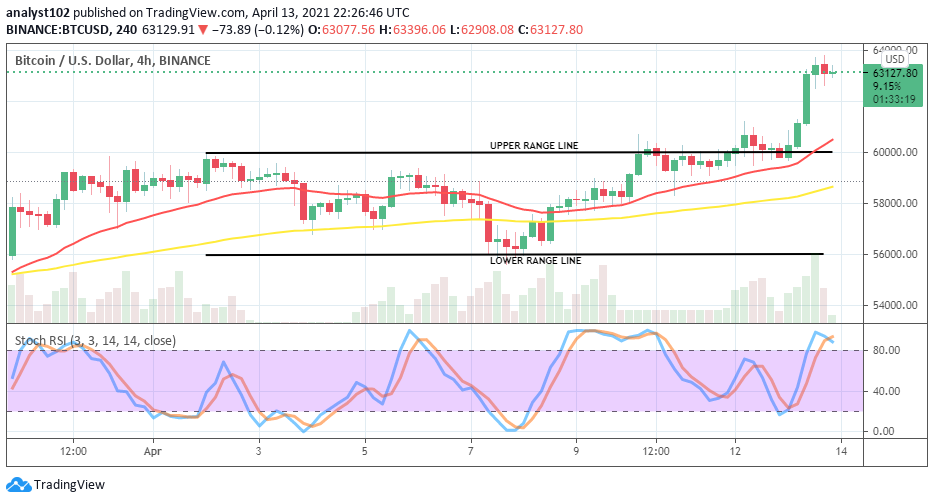
BTC/USD 4-hour Chart
The BTC/USD 4-hour chart, after the featuring of several downs and ups which at last metamorphosed into a distinct outlook of ranging trend in the medium-run, has now had the upper range line breached northwardly to suggest a change in the market direction. Based on that, the SMAs are now slightly facing the north far below the current price. The Stochastic Oscillators have moved into the overbought region to briefly cross the hairs in it. And, they now signify that a small degree of price reverses is ongoing. That suggests that the BTC/USD bulls have to be cautious of their new entry now.
Note: cryptosignals.org is not a financial advisor. Do your research before investing your funds in any financial asset or presented product or event. We are not responsible for your investing results.