Bitcoin Cash (BCH/USD) Rebounds from a near Low of $400
Estimated Reading Time: 3 minutes
Don’t invest unless you’re prepared to lose all the money you invest. This is a high-risk investment and you are unlikely to be protected if something goes wrong. Take 2 minutes to learn more
Bitcoin Cash Price Prediction – May 21
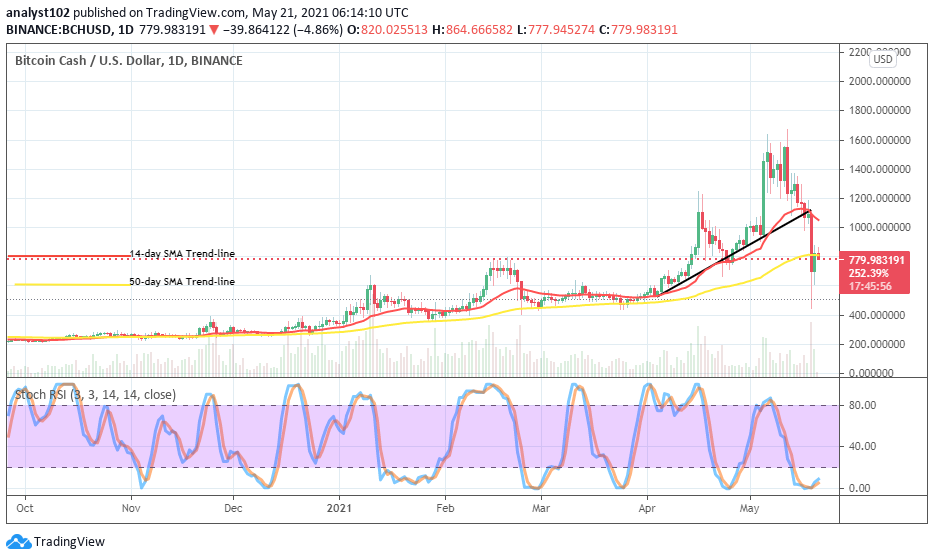
In the recent past trading session, the market worth of BCH/USD went aggressively under a falling sell-off situation to average the lower level of $400. Thereafter, the crypto’s price started pulling up on a gradual note to now trade around $784 with about -4.33% reductions.
BCH/USD Market
Key Levels:
Resistance levels: $1,000, $1,200, $1,400
Support levels: $500, $400, $300
BCH/USD – Daily Chart
The BCH/USD daily chart has recorded that on May 19, a sharp declining pressure occurred against most of the appreciating levels that the base instrument made in the past operations. The downward pressure was coupled with a reversal at the tail end. And, that has led to allowing the formation of a bullish candlestick yesterday taking its form from a support level of $600. The 50-day SMA indicator is located at the level of $800 as the 14-day is bent to the south from the top after it slightly crossed the bullish trend-line as well to the downside. The Stochastic Oscillators are in the oversold region trying to open the conjoined hairs to the north. That indicates that the base tool is making an effort to regain momentum.
How will the BCH/USD market regain its lost values?
It appears to take a while as long as the BCH/USD market value keeps hovering around the bigger SMA’s location at the level of $800. As that kind of scenario plays out, the levels below the point earlier mentioned will potentially serve as points of entry for investors as well as intending buyers. In the meantime, a full-body bullish candlestick between the two SMAs will most definitely suffice strong return the market to the upside.
In continuation of getting to see further price fall-offs of this market, bears need to make a stronghold around the level of $800. And, that as well could better achieve by rejecting an eventual upward to the higher point of $1,000. A total cross of the bigger SMA indicator to the south is most likely not going to be attained in the near time to be able to suggest a full return of bearish trend in the crypto economy.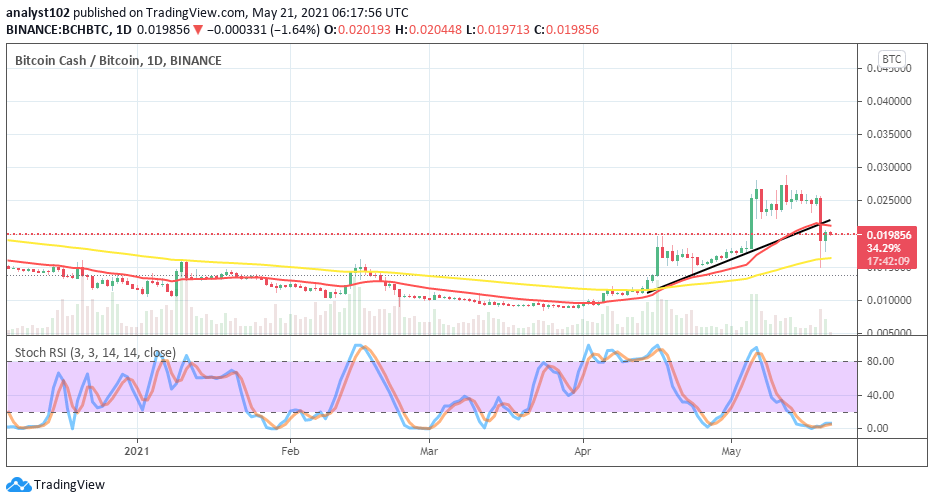
BCH/BTC Price Analysis
After a long line of range-bound movements at a higher trading level, it has now depicted on the chart that the base instrument eventually succumbed to a downward move that broke through both the bullish and the 14-day SMA trendlines. And, inclusively, the 50-day SMA was also briefly involved in the downward breaking motion. However, the SMAs are still pointing to the north to suggest that a continued breaking-down of the market may not be too long before it gets to an end. Being in the oversold region of the Stochastic Oscillators has also suggested that by seemingly trying to open the hairs back to the north. But, it may also take a while before that can be achieved. Meanwhile, a sudden emergence of a bullish candlestick at that level of trading will most probably put that sentiment playing out successfully.
Note: cryptosignals.org is not a financial advisor. Do your research before investing your funds in any financial asset or presented product or event. We are not responsible for your investing results.