Litecoin (LTC/USD) Price Keeps Afloat Above $65, Eyeing $70
Estimated Reading Time: 4 minutes
Don’t invest unless you’re prepared to lose all the money you invest. This is a high-risk investment and you are unlikely to be protected if something goes wrong. Take 2 minutes to learn more
Litecoin Price Prediction – February 5
Some re-swinging forces are generating in the market activities of Litecoin versus the exchange worth of the US Dollar, as the current financial status reveals that the crypto’s price keeps afloat above the point of $65, eyeing the resistance line of $70.
Up to $65, the lower Bollinger Band trend line has served as a helpful confirmatory factor. Because of that idea, it seems that bears will have difficulty enforcing decline motions against the point if they observe that bulls are inclined to give in to further draw downs from the middle Bollinger Band trading area. Any crypto-rebounding signal that the market may experience between the Bollinger Band indicators’ trading zones is what buyers should take advantage of.
LTC/USD Market
Key Levels:
Resistance levels: $75, $80, $85
Support levels:$65, $60, $55
LTC/USD – Daily Chart
The LTC/USD daily chart reveals that the crypto-economic market keeps afloat above the line of $65, eyeing the line of the $70 retardation line.
The stochastic oscillators have been systemically swerving northward, placing them beneath the line of 80. The outlook formation style of the candlesticks in that regard of the oscillators has been more bullish. The Bollinger Band trend lines are trending easterly between the spots marked by $75 and $65.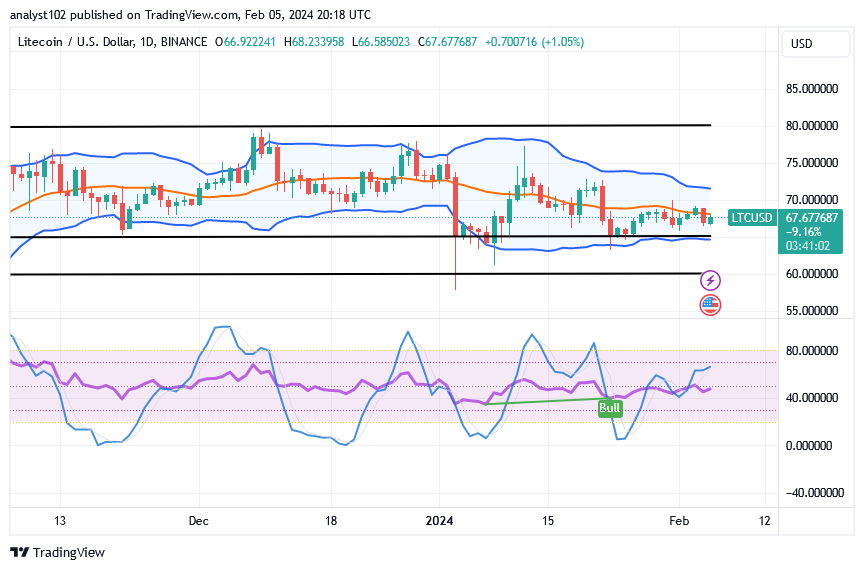
When the LTC/USD market trades at the midpoint of the indicators, what active price situation is likely to draw down further and steadily alongside the lower Bollinger Band?
A fake fearful pull-up toward the upper Bollinger Band will probably lead to a falling force that almost immediately resorts to reversal motion against the middle part, which could pave the way to pushing downward alongside the lower side as the LTC/USD market keeps afloat above $65, eyeing the value of $70.
Long-term investors shouldn’t be panicked by any trade condition that can possibly prompt the exchanging line into any form of decline between or against the lower parts of the Bollinger Band because it would be another cycle of letting buying orders be retaken at reduced rates before bouncing back again. Thereafter, there will be spurts of energy that surpass the majority of the prior high points.
Technically, an active decrease indication between the upper and middle Bollinger Band lines will need to be present in order to signal that the LTC/USD market is bearish and can potentially reclaim positions. When issuing a shorting position order at a late hour within or around those areas, sellers should exercise caution. Pre-launch positional sell orders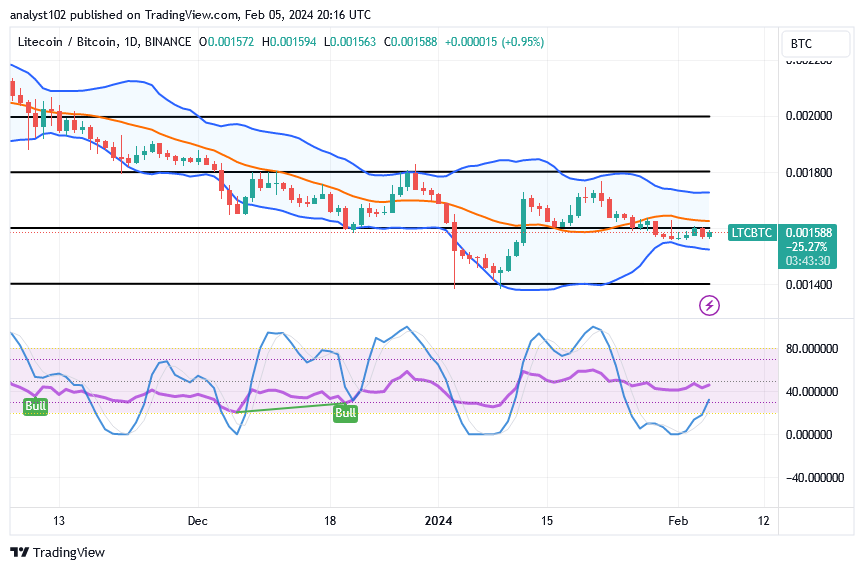
LTC/BTC Price Analysis
In contrast, the Litecoin trade keeps afloat above the lower Bollinger Band, pairing with the valuation of Bitcoin, eyeing the barrier line built around the middle Bollinger Band.
For a brief while, the Bollinger Band indications moved up from the lower section to place a baseline just below the candlestick pattern that has been present below the middle part for a few days. Stochastic oscillators are slightly northbound-crossing, indicating that purchasing activity between the two cryptocurrency economies will pick up steam if a strong bullish candlestick appears.
Note: Cryptosignals.org is not a financial advisor. Do your research before investing your funds in any financial asset or presented product or event. We are not responsible for your investing results.
You can purchase Lucky Block here. Buy LBLOCK