Litecoin (LTC/USD) Market Faces a $70 Barrier, Tending a Correction
Estimated Reading Time: 4 minutes
Don’t invest unless you’re prepared to lose all the money you invest. This is a high-risk investment and you are unlikely to be protected if something goes wrong. Take 2 minutes to learn more
Litecoin Price Prediction – January 30
Lesser northward active positive pressures have been embarked upon by bulls in the exchanging environments that involve the valuation of Litecoin versus the worth of the US Dollar, as the crypto economic trade faces a $70 barrier, tending a correction at a minute negative percentage pace.
In reaction to the likely decrease in crypto signal created by the middle Bollinger Band trend line, the market’s negativity rate has caused the price to trade at roughly $67.90. While maintaining such a trade condition for a while, in a worst-case scenario, the dropping lines are unlikely to appear above the $60 objective in opposition to the positions of buyers.
LTC/USD Market
Key Levels:
Resistance levels: $75, $80, $85
Support levels:$65, $60, $55
LTC/USD – Daily Chart
The LTC/USD daily chart showcases that the crypto trade faces a $70 barrier line, tending to a correction on the sell side of the middle Bollinger Band.
The Bollinger Band trend lines are seemingly laying in resistance to the current trade situation between the mid-points of the indicators. A firm falling correctional movement could bring the market back down to revisit the low around the lower Bollinger Band. The stochastic oscillators are tentatively attempting to cross back to the south at close points found above 40.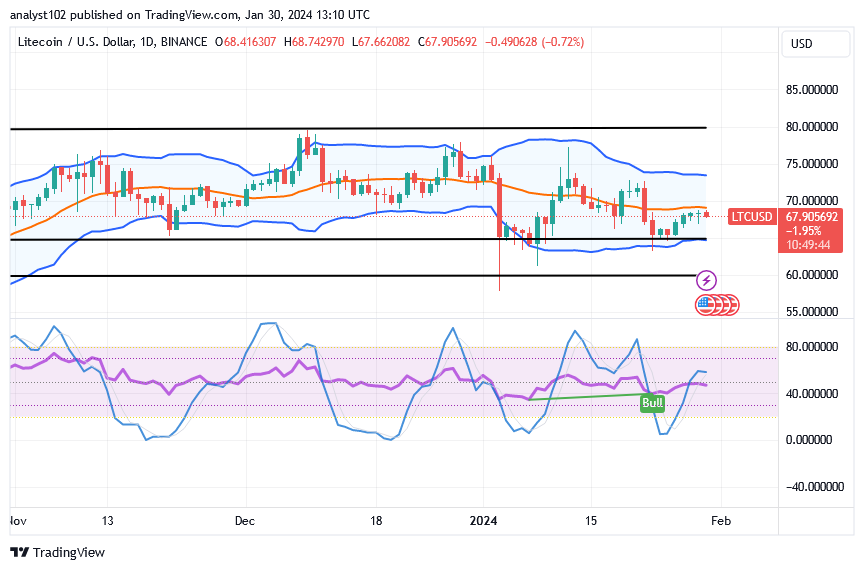
How long will the LTC/USD market stay below the $70 trade barrier line?
The repositioning style of the stochastic oscillators with a crypto signal cycle bordering on a bullish candlestick around the lower part of the Bollinger Band indicators will give a better trade projection toward getting uprising forces, given that the LTC/USD market faces a $70 barrier line, tending to a correction.
Despite the fact that there is a clear indicator that the market is moving higher in the next few operations, because of that idea, it would be wise for purchasers to negotiate hard and attach significant value to any potential decline in the market that occurs at prices below $70.
As of the writing of this article, shorting operations must not be carried out constantly, particularly if the moves to the down side are unable to retrace significant troops to the south side. Price will most likely turn positive and reach a point around the upper Bollinger Band if there is a consistent reversal action against the current minor fall.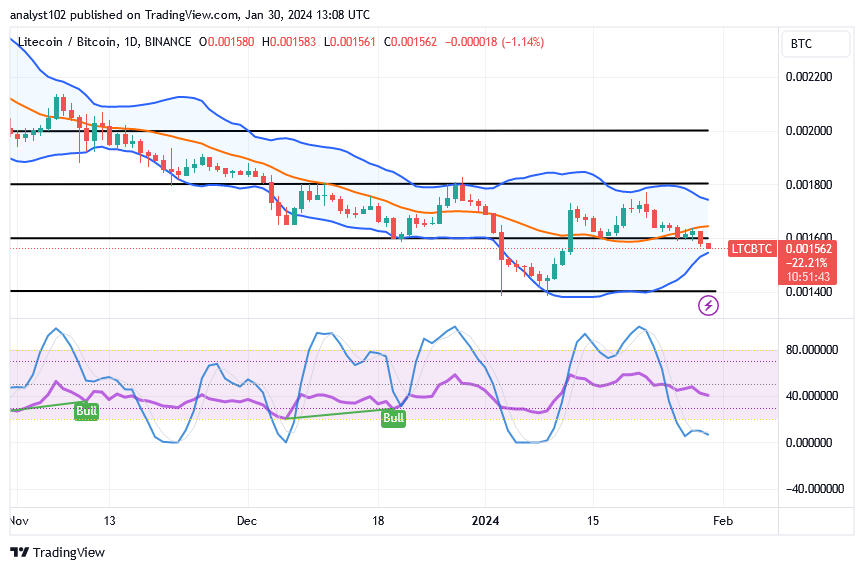
LTC/BTC Price Analysis
In contrast, the Litecoin market is tending to place further lower lows against Bitcoin, possibly to create an environment for regaining up-swinging forces.
Placers in long positions may wait for a bullish candlestick to form around the lower Bollinger Band line in order to begin cultivating the idea of placing buy orders again. The blue part of the indicators on the stochastic oscillators has slipped into the oversold area. Difficult trade circumstances will result from focusing too much on the potential for the market to decline much deeper during a consolidation. Thus, obtaining a recovery session for the paired cryptocurrency e-business sector in the near future must be given top attention.
Note: Cryptosignals.org is not a financial advisor. Do your research before investing your funds in any financial asset or presented product or event. We are not responsible for your investing results.
You can purchase Lucky Block here. Buy LBLOCK