Bancor (BNTUSD) Fails and Falls From the $4.800 Resistance Level
Estimated Reading Time: 3 minutes
Don’t invest unless you’re prepared to lose all the money you invest. This is a high-risk investment and you are unlikely to be protected if something goes wrong. Take 2 minutes to learn more
Market Analysis – Bancor Fails to Subdue $4.800 and Falls to $3.850
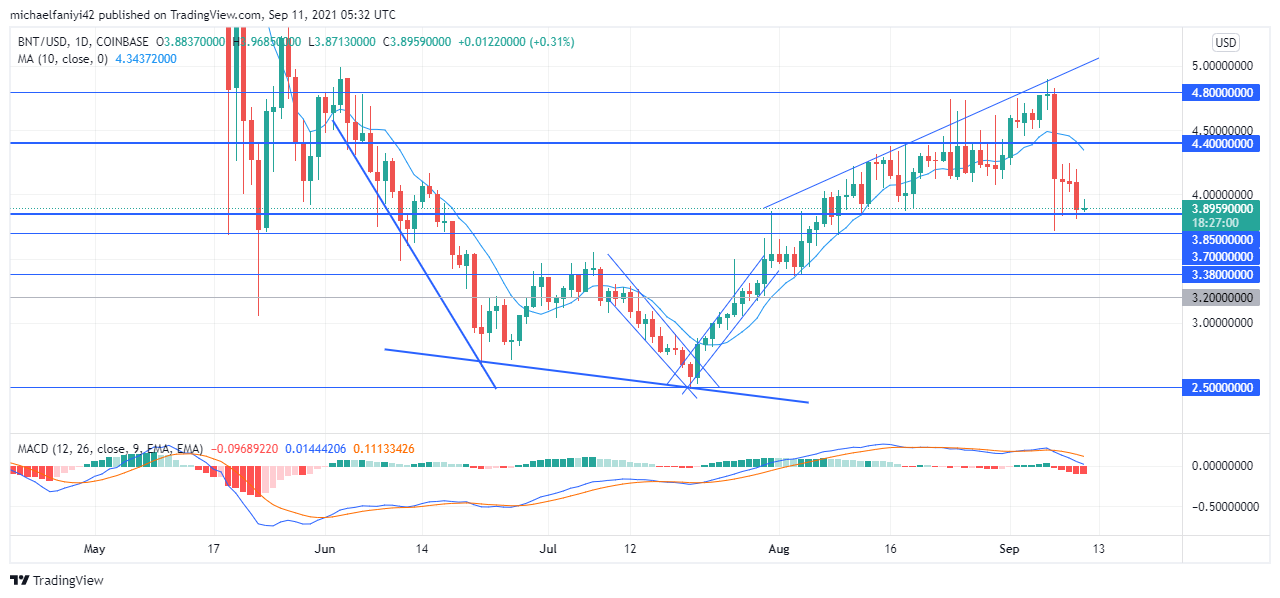
Bancor fails and falls to a low of $3.70 after failing to get above the $4.800 key level. This comes as a huge setback to the bullish momentum of the market which has brought price thus far. The market rally restarted from the $2.500 key level on the 21st of July 2021 after an initial failure at $3.380. Price will ascend past the key level at the second time of asking. There was, however, a bit of testing below the $3.850 resistance. Price eventually bypassed it to find a greater challenge in breaking past $4.400.
Significant Bancor Zones
Resistance Zones: $4.400, $4.800, $5.500
Support Zones: $3.850, $3.700, $3.380
The market found great difficulty in moving above the $4.400 key level. As bulls gradually pushed upward, price began to range. It took 26 days for the market to get above the key level. On September 1st, price broke through it upward to meet the $4.800 resistance level. Price was immediately rejected upon contact. This can be seen in the display of the spinning top candlestick at the point of contact on the 6th of September, which signifies temporary market indecision.
What followed next was a plummeting of the market, which dashed the price below $3.700. Bancor recovered to $3.850, but since then it has been struggling to climb further, and it seems to even be showing more bearish tendencies. Price remains below the MA period 10 (Moving Average) after dashing through it earlier. The MACD (Moving Average Convergence Divergence) indicator is showing increasingly bearish histogram bars and its lines are plunging towards the zero level. If bulls can recover at this point, it will prevent bearish pressure from coming in to drive the market lower.

Market Expectations
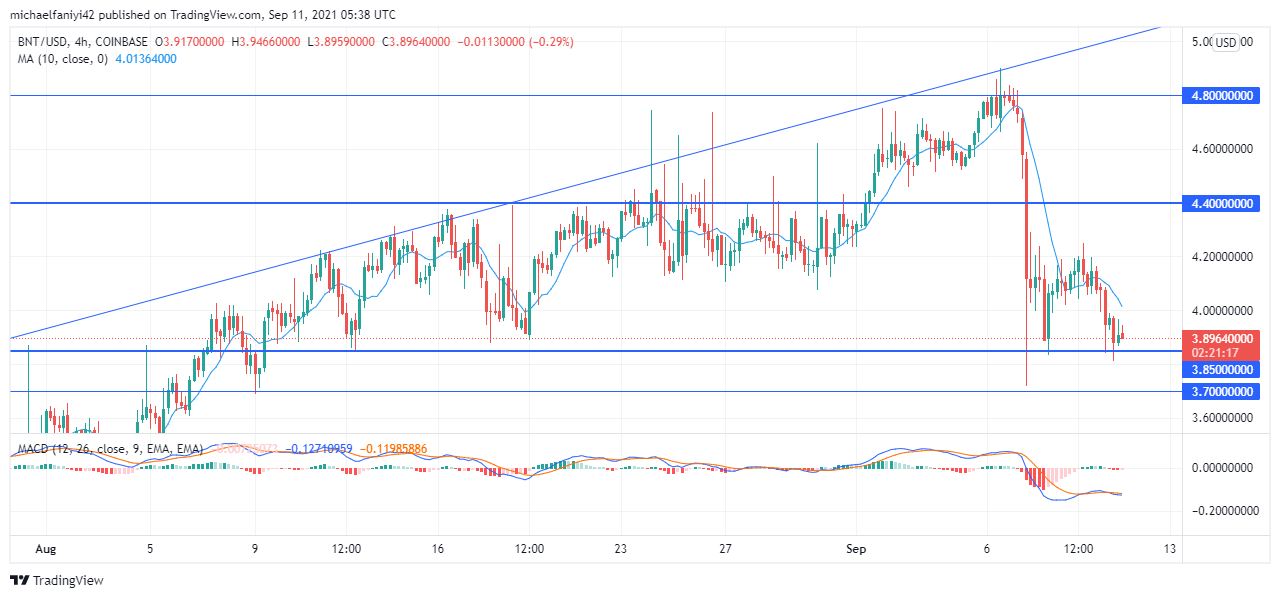
On the 4-hour chart, the market can be seen undulating in an expanding triangle. At the moment, bears have now stepped into the market, but the $3.850 support is defending the marketing from falling further. On the MACD chart, despite the indecisiveness of the histogram bars, there is now a cross of the lines to the downside of the lines which signifies more bearish movement. The MA 10 remains aligned above the market to show bullish intent.
Bancor is likely to begin consolidation at this $3.850 level with the $4.400 level as resistance.
Note: Forexschoolonline.com is not a financial advisor. Do your research before investing your funds in any financial asset or presented product or event. We are not responsible for your investing results.