EigenLayer (EIGEN/USDT) Eyes Potential Upside Movement
Estimated Reading Time: 3 minutes
Don’t invest unless you’re prepared to lose all the money you invest. This is a high-risk investment and you are unlikely to be protected if something goes wrong. Take 2 minutes to learn more

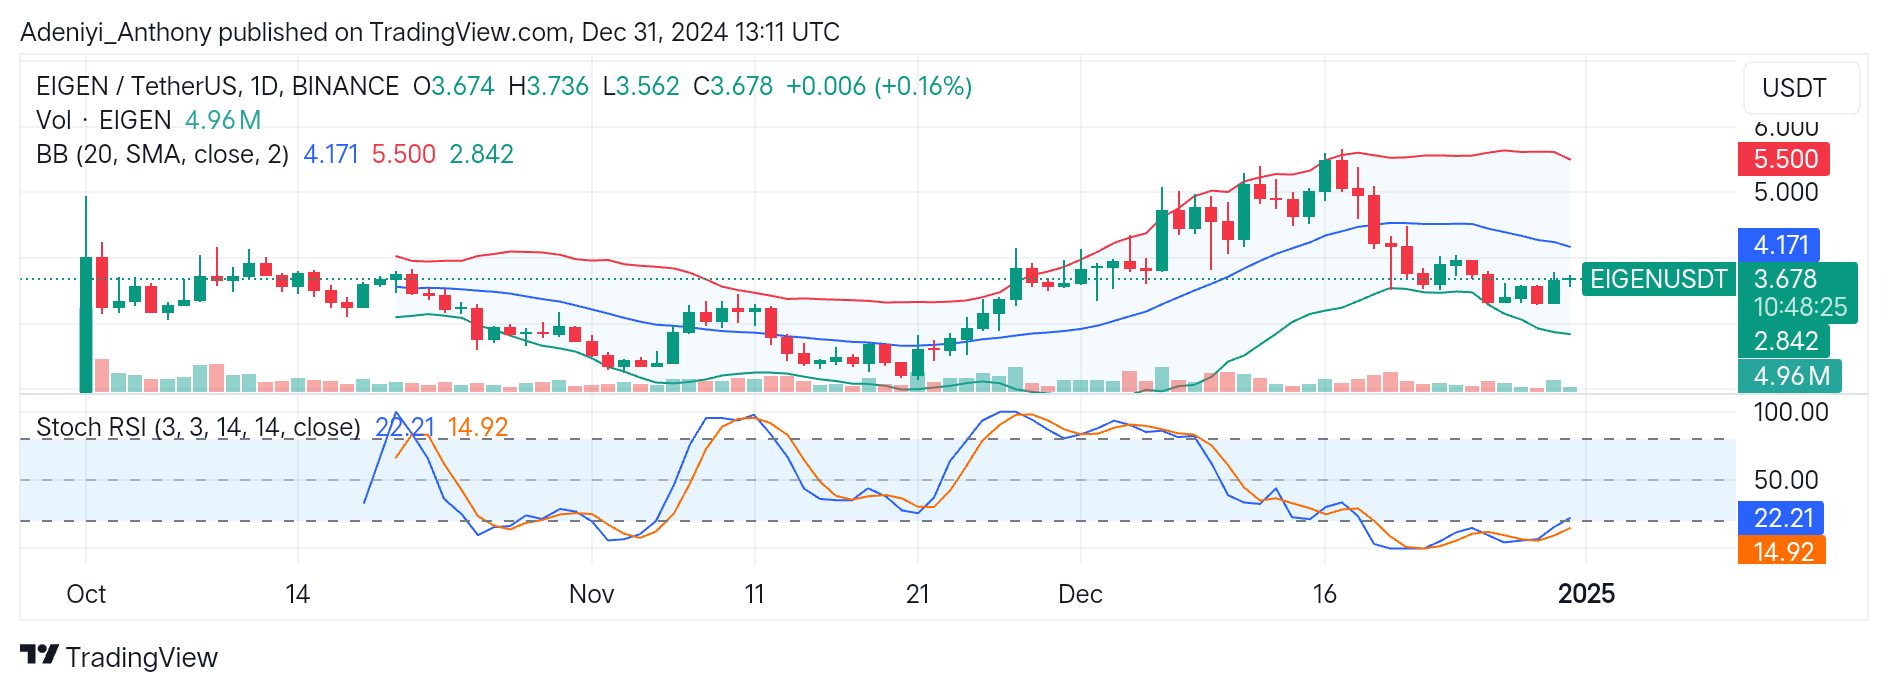
The market for Eigenlayer against the Tether indicates a market moving a defined range after a volatile price swings in previous moves. Recent price actions show the pair were operating at the upper Bollinger band before breaking below the dynamic 20-SMA for the lower band.
However, the indicators on the chart below suggest an impending move toward the mid-line at $4.171, as the Stochastic RSI signals a weakened selling pressure.
Currently, EIGEN/USDT trades at $3.678 after recording a 0.16 marginal move to the North, with over 4 million daily traded volumes.
Technical Indicators
Major Resistance Levels: $4.000, $4.171, and $5.000
Major Support Levels: $3.500, $3.000, and $2.842
EigenLayer Technical Analysis
The analysis of Eigenlayer against the USDT on the daily timeframe shows the pair has been on a prolonged downtrend after hitting the $5.500 resistance level. However, recent price action near the mid-band signals a reduced selling pressure, with the potential of breaking above $4.171 in the near term. On the contrary, a reduction in the current momentum and a break below the $3.500 indicate a downtrend.
On the other hand, the Stochastic RSI shows that the pair is operating in the oversold region. This depicts a heightened selling condition. However, with the lines pointing to the North, the indicator signal the potential end of a bearish session and impending uptrend if the momentum keeps building.
EIGEN/USDT Analysis: Positioned for a Short-term Recovery
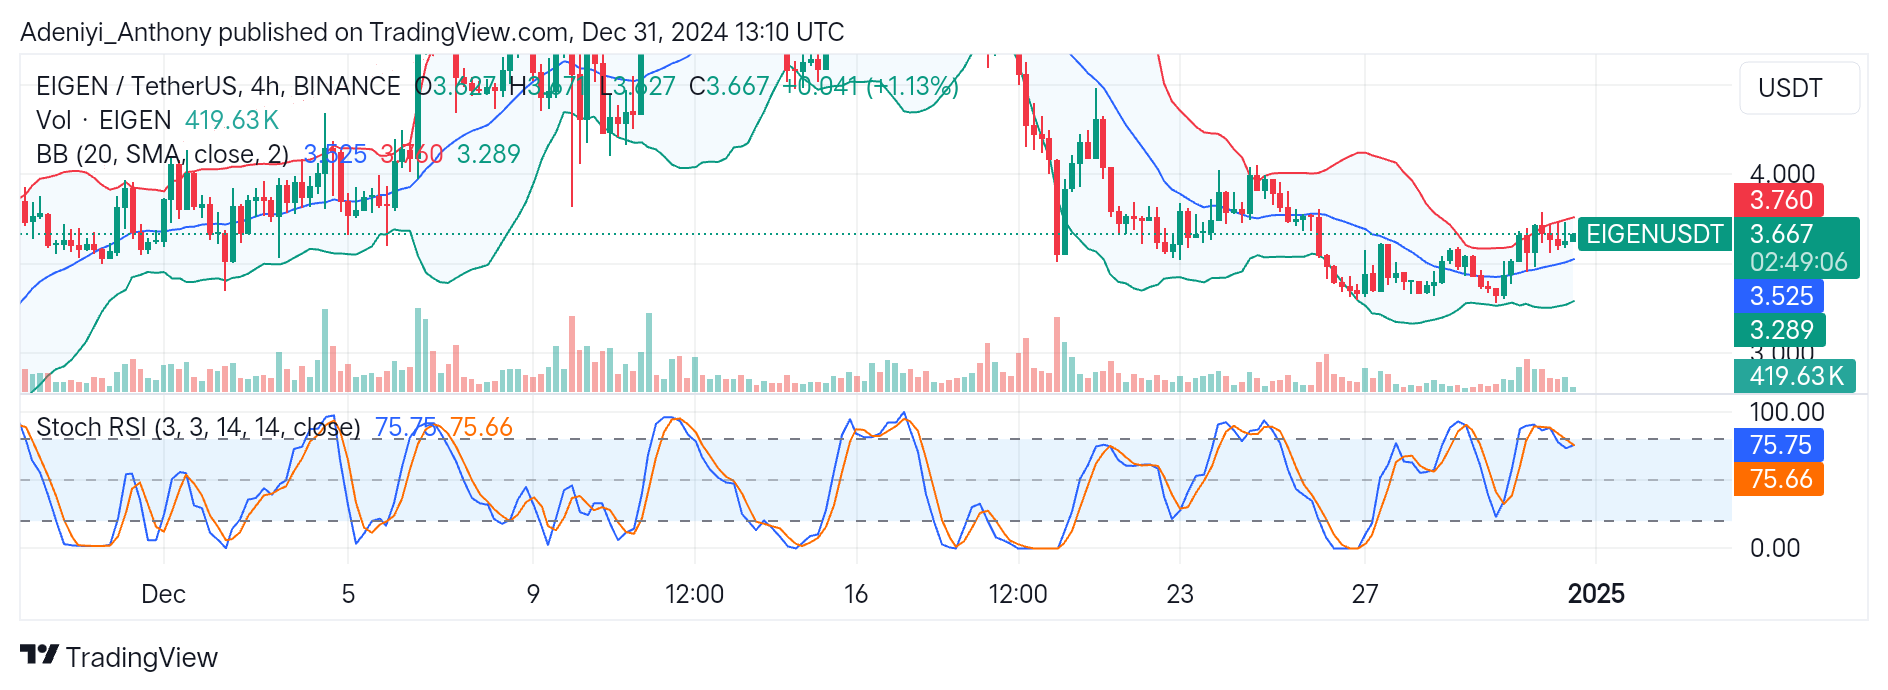
On the 4-hour timeframe, the chart of EIGEN/USDT shows the pair is attempting a short-term recovery as the price tends towards the upper Bollinger band with an increase of 1.13% above the previous trading session.
On the other hand, the Stochastic oscillator shows that the pair operates in the overbought region. Though this indicates strong buying pressure, it also suggests the current uptrend may be nearing exhaustion, further picturing a market with cautious optimism.
To this end, with the mild bullishness, a move above $4.000 is possible if the momentum is increased; otherwise, as the Stochastic warns of overbought conditions, a retracement towards the lower support levels is possible if momentum drops.
You can purchase crypto coins here. Buy LBlock