Litecoin (LTC/USD) Market Pushes to Hit Resistance at $80
Estimated Reading Time: 3 minutes
Don’t invest unless you’re prepared to lose all the money you invest. This is a high-risk investment and you are unlikely to be protected if something goes wrong. Take 2 minutes to learn more
Litecoin Price Prediction – November 30
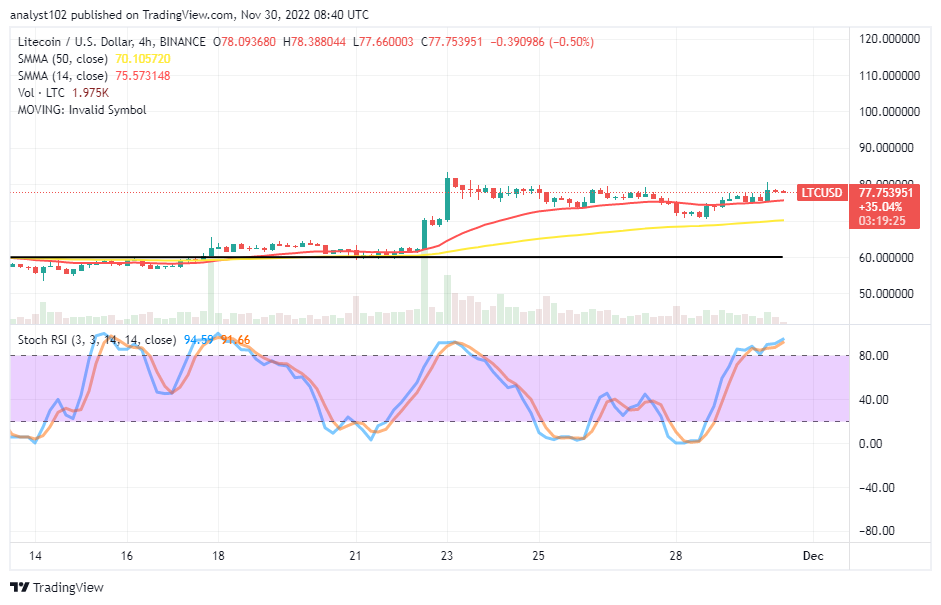
In the wake of upward-leftover forces in the LTC/USD trade operations, the crypto pushed to hit resistance at the $80 trading line about three days ago. Presently, the price trades at a $77.753951 value line at a minute percentage rate of 0.50 negative.
LTC/USD Market
Key Levels:
Resistance levels: $85, $90, $95
Support levels: $70, $65, $60
LTC/USD – Daily Chart
The LTC/USD daily chart showcases the crypto market’s pushes to hit resistance at the $80 level closely over the smaller SMA trend line. The 14-day SMA indicator is at $75.573148, underneath the $70.105720 value line of the 50-day SMA indicator. The horizontal line is around the $60 support level, indicating the main point where current upswings have sprung. The Stochastic Oscillators are in the overbought region, pointing slightly northbound to signify that some pull-up forces are relatively in focus.
Will LTC/USD trading continue to prosper over the SMA points?
At the moment, any attempt to forcefully break northward through the variant resistances in the LTC/USD trade activities may lead to completing an upward motion price has embarked over time as the crypto economy has pushed to hit resistance around the $80 level during the 28th session of this month. Long-position placers are to wait for another cycle of retracement moves to occur toward lower-trading spots of either $75 or $70 to observe the launching of a buying order.
The LTC/USD market may see a correction between the speed of the $75 and the $80 levels following the technical analysis’s downside. On the contrary, a sudden aggressive breakout from those points will let bears suspend actions until a bearish candlestick forms to denote an end to getting sustainable upward forces. Based on that sentiment, sellers have to look out to execute a shorting order instantly when it tends to play out.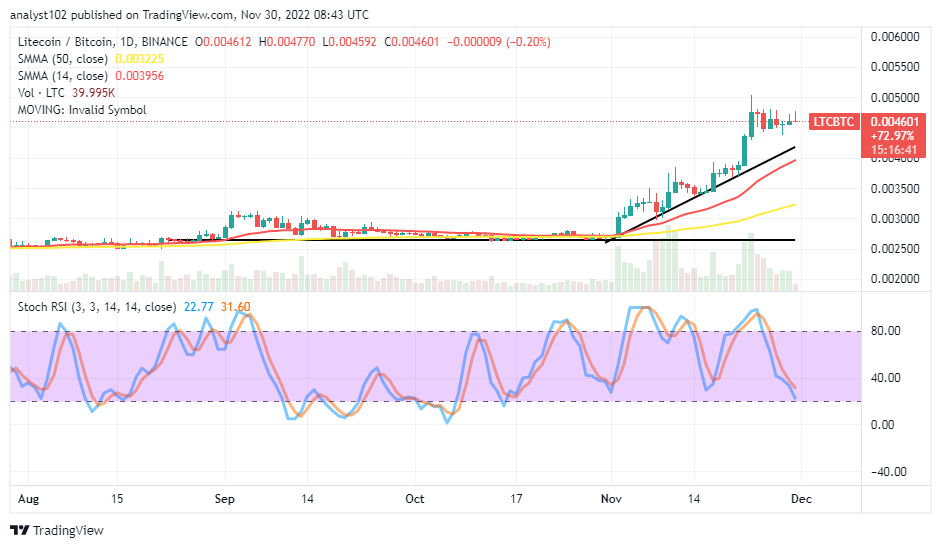
LTC/BTC Price Analysis
Litecoin’s trending ability compared with Bitcoin has been spiraling to the top trading spots over days. In the meantime, the pairing cryptocurrency appears to have hit resistance around a high-trading zone over the SMA trend lines. Compared to the 50-day SMA indicator, the 14-day SMA indication is higher. The Stochastic Oscillators have been in the south direction at 31.60 and 22.77 levels. That denotes a pit halt along the way to continuing to move upward.
Note: Cryptosignals.org is not a financial advisor. Do your research before investing your funds in any financial asset or presented product or event. We are not responsible for your investing results.
You can purchase Lucky Block here. Buy LBLOCK