The Zcash (ZECUSD) Market Finally Joins the Bullish Trend
Estimated Reading Time: 3 minutes
Don’t invest unless you’re prepared to lose all the money you invest. This is a high-risk investment and you are unlikely to be protected if something goes wrong. Take 2 minutes to learn more
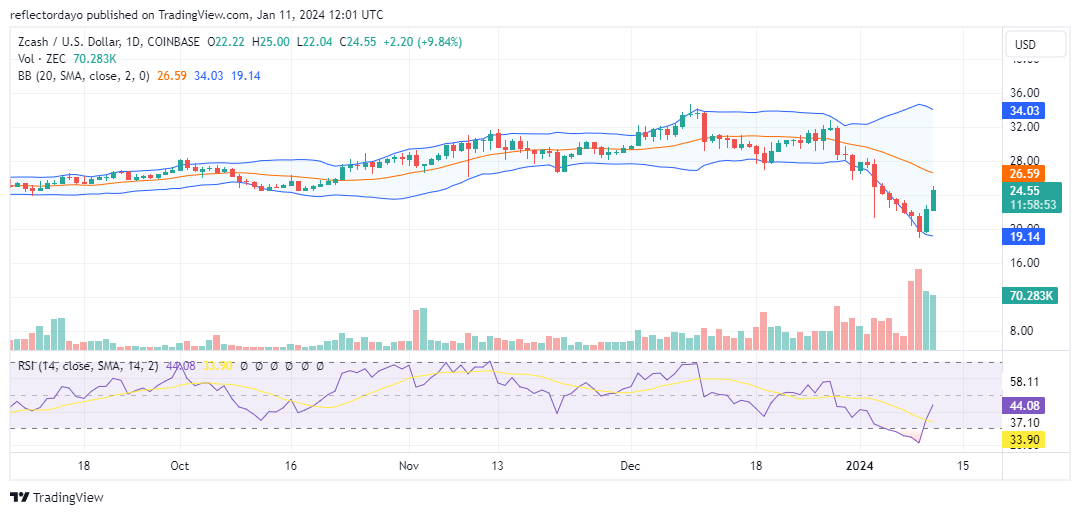
For an extended period, the Zcash market has exhibited a sideways trend. Upon analysis of the daily chart, it is apparent that the trading volume remains relatively low, indicating a potential lack of interest among investors. Despite the subdued trade volume, there were intermittent bursts of market activity leading to minor upward price shifts during specific trading periods.
However, by the conclusion of 2023, there had been a noticeable increase in trade volume. Regrettably, this surge in activity coincided with the onset of a bear market, resulting in a downward shift in prices.
Zcash Market Data
- ZEC/USD Price Now: $24.50
- ZEC/USD Market Cap: $400,690,901
- ZEC/USD Circulating Supply: 16,328,269 ZEC
- ZEC/USD Total Supply: 16,328,269 ZEC
- ZEC/USD CoinMarketCap Ranking: #136
Key Levels
- Resistance: $27.00, $28.50, and $30.50.
- Support: $22.00, $20.00, and $19.00.
Zcash Market Forecast: Analyzing the Indicators
Upon assessing the market development, it appears that investors capitalized on the increasing trade volume to break free from the long-term market stagnation. This bearish price movement has the potential to initiate bullish activities. Although there was a near occurrence on January 3, the bulls could not sustain the momentum, leading to additional selling pressure and bringing the market to the threshold of $20.00.
On January 8, the trade volume indicator exhibited a substantial histogram alongside a diminutive bearish candlestick. This signaled an impending shift in market dynamics, and as anticipated, the market reversed course. Over the last two days, two bullish candlesticks have materialized, albeit with small upper shadows. These upper shadows highlight their effort to overcome bearish resistance. Currently, the Relative Strength Index (RSI) measures momentum at 44, with a rapidly ascending RSI line. Given the current Zcash market trajectory, there is a likelihood that the price may soon cross the 20-day moving average.
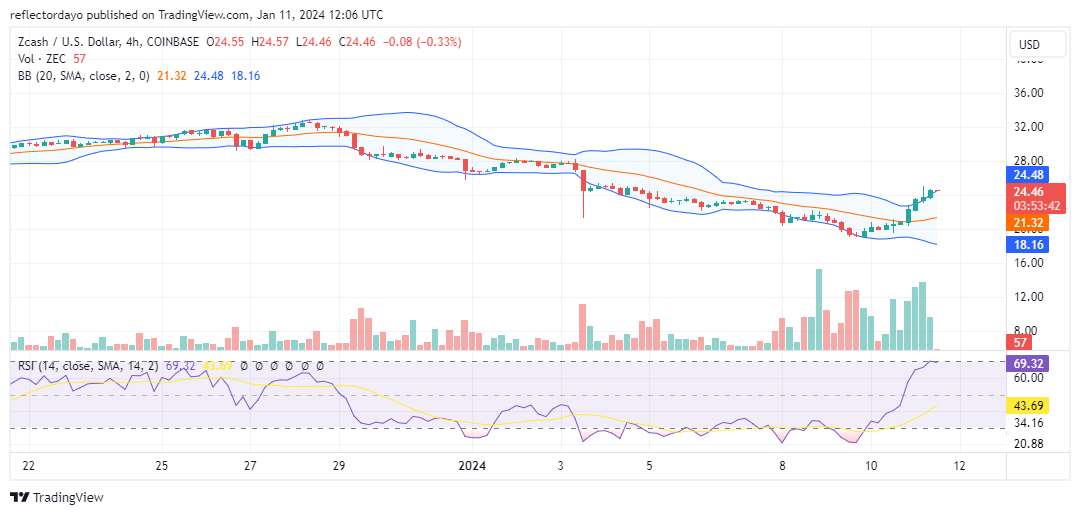
ZEC/USD 4-Hour Chart Outlook
From the perspective of the 4-hour chart, the indicators depict the strength of the bullish trend as robust, despite encountering resistance. Over the last three 4-hour trading sessions, the bullish market has grappled with resistance around the $24.00 price level. Presently, the market has surpassed the $24 price level. Following the successful breakthrough at this price level, the volume of trade indicator has registered a decline, potentially contributing to the prevailing market gridlock in the current trading session. It is plausible that the market may consolidate at this juncture before resuming its upward trajectory. A potential target for the next move could be around $28.