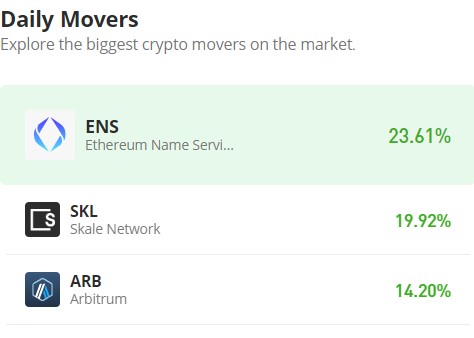
Skale Network (SKL/USD): Bullish Momentum Faces Bearish Resistance, Targeting the $0.100 Milestone
Estimated Reading Time: 3 minutes
Don’t invest unless you’re prepared to lose all the money you invest. This is a high-risk investment and you are unlikely to be protected if something goes wrong. Take 2 minutes to learn more
In the early part of the new year, the Skale Network market made a robust advance towards the $0.100 price mark. However, it encountered significant resistance, establishing a formidable barrier. Subsequently, a retracement occurred as bullish forces consolidated around the $0.08 mark, representing a higher resistance compared to the previous level of $0.0681. The establishment of this higher support level is poised to exert upward pressure on the $0.100 price threshold, potentially paving the way for a breakthrough of the resistance level.
Skale Network Market Data
- SKL/USD Price Now: $0.0885
- SKL/USD Market Cap: $452,377,515
- SKL/USD Circulating Supply: 5,134,227,671 SKL
- SKL/USD Total Supply: 5,447,166,667 SKL
- SKL/USD CoinMarketCap Ranking: #117
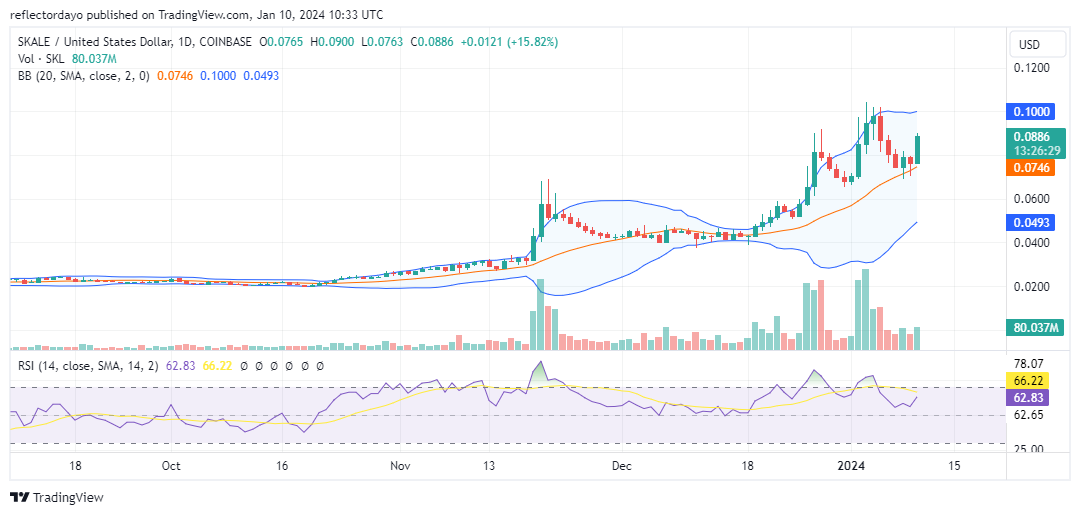
Key Levels
- Resistance: $0.100, $0.110, and $0.120.
- Support: $0.085, $0.080, and $0.075.
Skale Network Market Forecast: Analyzing the Indicators
In today’s trading session, there has been an approximately 20% increase in value. The candlestick pattern exhibits strong bullish sentiment, characterized by a minimal upper shadow, suggesting substantial buying activity. Bullish momentum is driving towards the $0.100 price level once more, and given the established support around $0.088, there is potential for the price to surpass this threshold.
The upper standard deviation curve of the Bollinger Bands indicator remains relatively flat, reflecting the pronounced retracement observed after the price reached $0.100. Conversely, both the simple moving average and the lower standard deviation are trending upward, as the retracement did not breach the SMA line. This trend underscores the dominant position of bullish investors in the market. However, the slight upper shadow on the bullish candlesticks indicates lingering bearish sentiment near the critical resistance level.
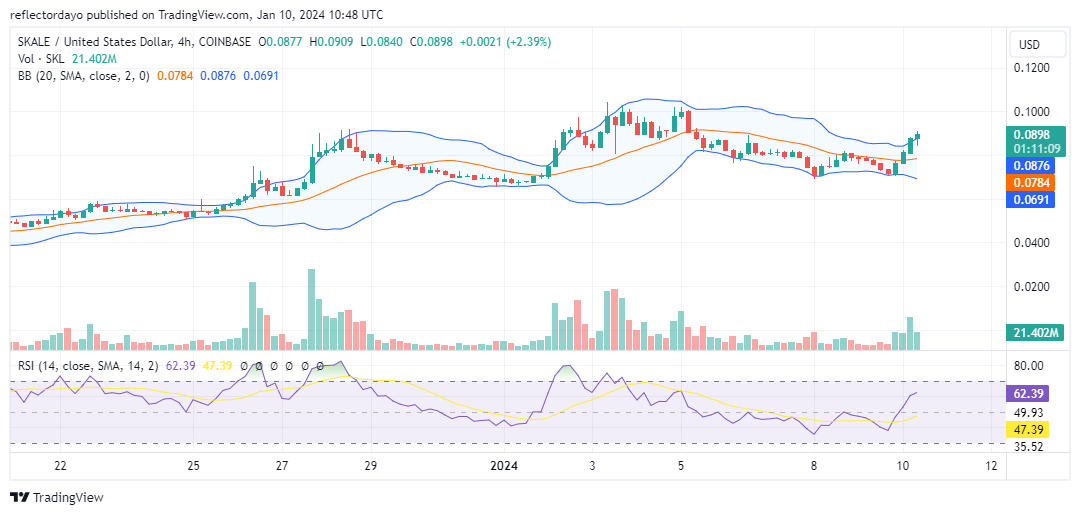
SKL/USD 4-Hour Chart Outlook
Upon analyzing the 4-hour chart, the trade volume indicator displays prominent histograms supporting the bullish price movement. Additionally, the recent appearance of a hammer candlestick on the current 4-hour chart suggests a robust bullish signal. Taking these factors into account, the market is poised to approach the $0.100 price level in the near term. Nevertheless, it is anticipated to encounter substantial resistance around the $0.100 mark.