Filecoin (FIL/USD) rallies to June’s High
Estimated Reading Time: 2 minutes
Don’t invest unless you’re prepared to lose all the money you invest. This is a high-risk investment and you are unlikely to be protected if something goes wrong. Take 2 minutes to learn more
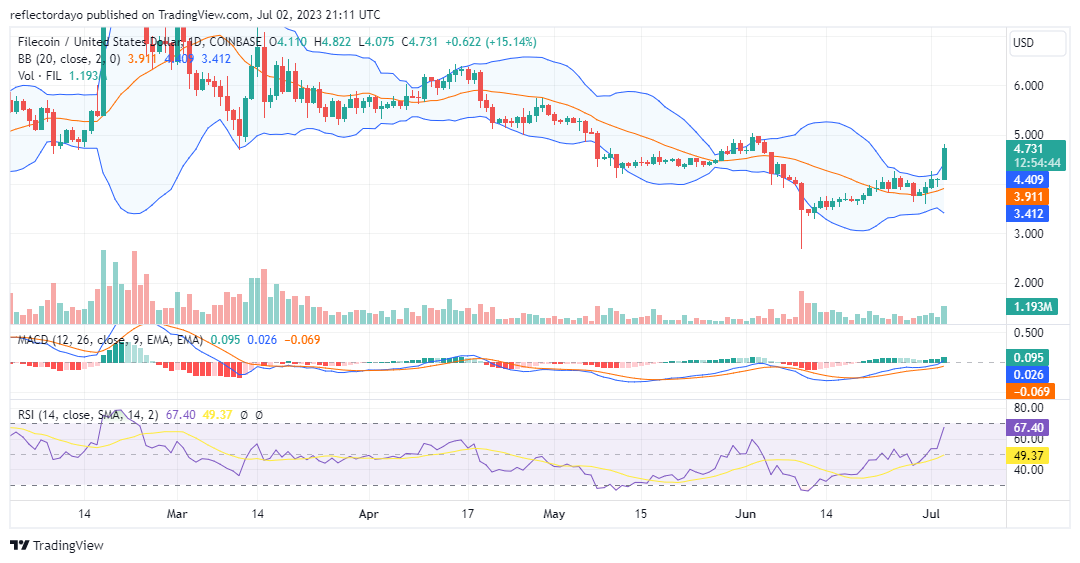
The first half of June was dominated by the Filecoin bears, bringing the market to the year’s low of $2.7. That was very far into bullish territory, and since then, bulls have begun to slowly but progressively take over the market until they reached the barrier of the $4.123 resistance price level on June 22. The bullish trend has been pegged around this level since June 23.
However, in today’s market, the bull market has broken out of the indecision, and they are nearing the June 2 resistance, from where the bear market was triggered.
Filecoin Market Data
- FIL/USD Price Now: $4.759
- FIL/USD Market Cap: 2,053,419,510
- FIL/USD Circulating Supply: 433,564,695 FIL
- FIL/USD Total Supply: 1,962,031,132
- FIL/USD CoinMarketCap Ranking: #30
Key Levels
- Resistance: $5.00, $5.50, and $6.00
- Support: $3.00, $2.00, and $1.00.
Price Prediction for Filecoin: The Indicators’ Point of View
The $4.00 price level presented a major hindrance to the Filecoin bull market on its way to recovery, as buyers and sellers faced off around the price level between June 22 and July 2. The volume of trade at those times was not low; it was considerably high, showing a high level of investment interest in the market, but indecision has been a bit of a setback for the bull market.
Today’s market features strong buying activities, and this has caused the Bollinger Bands to diverge, showing increasing volatility, which could make the Filecoin bears formidable around the $5.00 price level.
FIL/USD 4-Hour Chart Outlook
As expected, resistance is forming at the $4.8 price level. The bullish trend seems very strong, so the likely possibility is that the price will consolidate at this level before continuing the uptrend.
So far in the day, the Filecoin market has gained so much momentum that both the Bollinger Indicator and the Relative Strength Index (RSI) now portray an astronomical rise of the price into the overbought zone. The market still holds the possibility for the continuation of the trend because, instead of retracement, it ranges at the 76.77 level of the Relative Strength Indicator.