Bitcoin (BTC/USD) Trade Gravity Recesses at $17,000
Estimated Reading Time: 3 minutes
Don’t invest unless you’re prepared to lose all the money you invest. This is a high-risk investment and you are unlikely to be protected if something goes wrong. Take 2 minutes to learn more
Bitcoin Price Prediction – December 7
In the way of a continual inactivities outlook between buying and selling actions in the BTC/USD market operations over time, the crypto trade gravity is currently recessing around the $17,000 zone. Price is at $17,025.24 between the high and the low-value points of $17,141.78 and $17,011.95 at an average minimal negative percentage rate of 0.43.
BTC/USD Market
Key Levels:
Resistance levels: $18,000, $19,000, $20,000
Support levels: $16,000, $15,000, $14,000
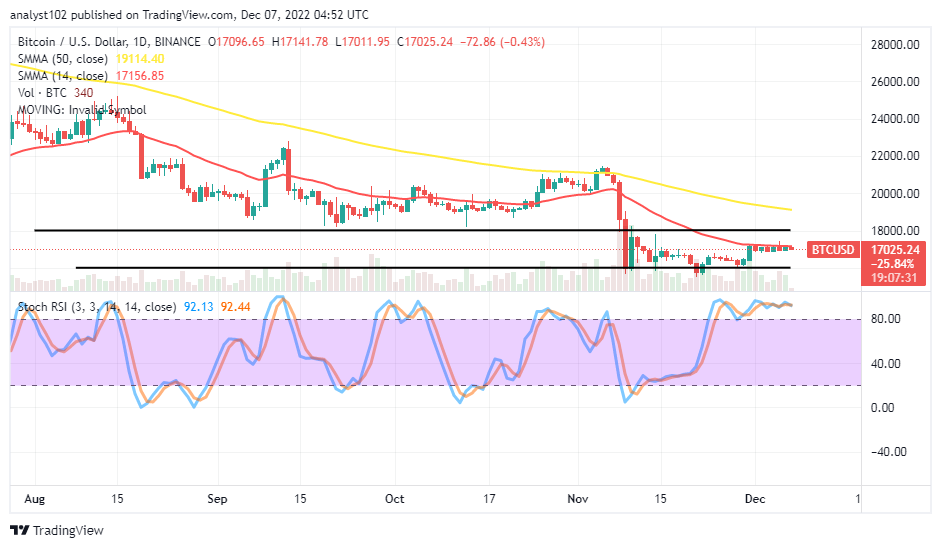
BTC/USD – Daily Chart
The BTC/USD daily chart exposes the crypto trade gravity recessives at the $17,000 trading line tightly beneath the smaller SMA. The 14-day SMA indicator is at $17,156.85, underneath the $19,114.40 value point of the 50-day SMA indicator. The Stochastic Oscillators are in the overbought region. Additionally, they maintain their positions at the 92.44 and 92.13 levels as a light signal that the price is currently declining.
Which direction is the BTC/USD market likely to move in the upcoming trading session?
As it is, the BTC/USD market exposes to the risk of shifting values in the southward direction as the crypto-economic trade recesses around the $17,000 trading zone. If that assumption has to play out as expected, buyers will have to be wary of following any attempt of the market to push forcibly northward away from the spot of the 14-day SMA indicator. It would be more psychologically okay to let the Stochastic Oscillators portend lower-trading levels before considering a decent probability chance to get a longing order.
On the negative side of the BTC/USD market’s technical analysis, despite the current suggestion that the crypto business is in an overbought region condition, sellers still need to look out for active falling motion around the 14-day SMA trend line before executing a shorting order. And they need to put a stop loss order between $17,500 and $18,000 in the course of doing that.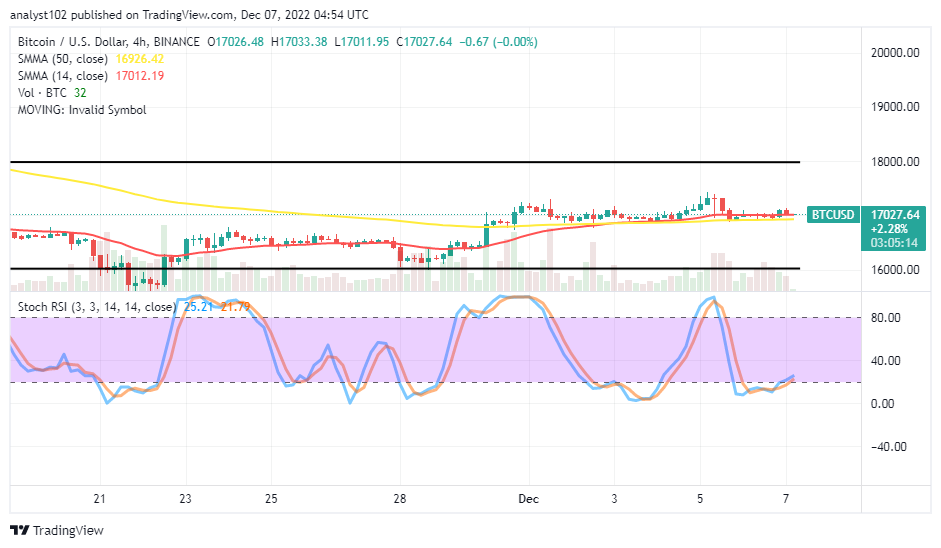
BTC/USD 4-hour Chart
The BTC/USD medium-term chart reveals that the crypto trade gravity recesses around $17,000. The upper and lower horizontal lines mark two alternative points of $18,000 and $16,000 to determine the price of the range-bound location. The 14-day SMA indicator is at $17,012.19, closely above the $16,926.42 value line of the 50-day SMA indicator. The Stochastic Oscillators are trying to briefly travel out of the oversold region to be around 21.79 and 25.21 levels, denoting that price is struggling to push back upward.
Note: Cryptosignals.org is not a financial advisor. Do your research before investing your funds in any financial asset or presented product or event. We are not responsible for your investing results.
You can purchase Lucky Block here. Buy LBLOCK