Polkadot Is in a Fresh Decline as It Faces Resistance at $7.29
Estimated Reading Time: 2 minutes
Don’t invest unless you’re prepared to lose all the money you invest. This is a high-risk investment and you are unlikely to be protected if something goes wrong. Take 2 minutes to learn more

Polkadot (DOT) Long-Term Analysis: Bearish
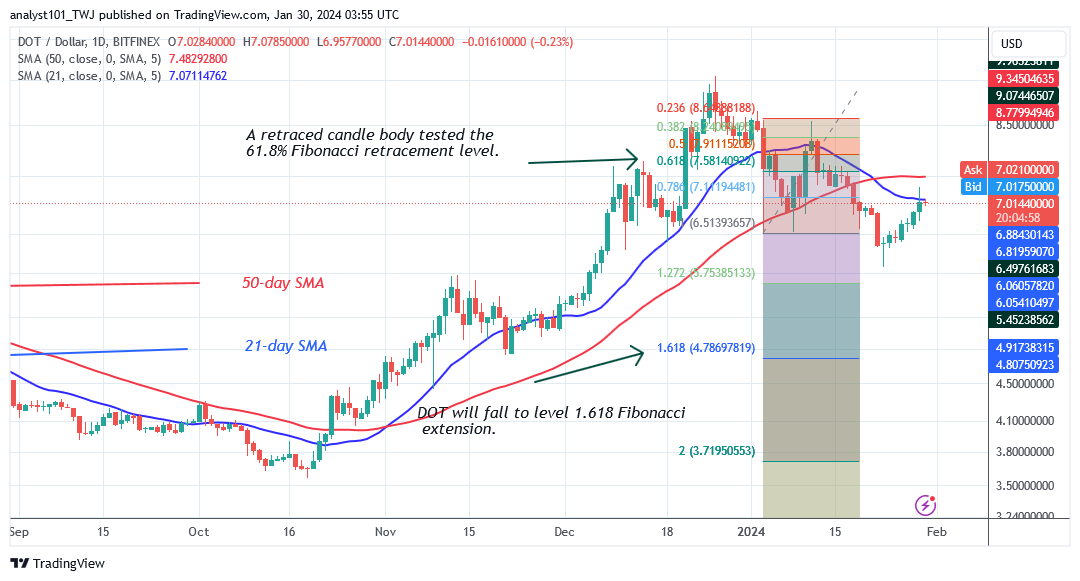
Polkadot (DOT) is trading below the moving average lines as it faces resistance at $7.29. The altcoin has been in an upward correction for the past week, peaking at $7.29. Buyers failed to maintain their bullish momentum above the 21-day SMA. The altcoin is retracing as it faces rejection at the 21-day simple moving average. Polkadot will fall to its lows of $6.53 and $6.29.
Nonetheless, if bears breach below the previous lows, the market will fall below the breakthrough level of $5.87. Meanwhile, the DOT/USD pair is trading at $6.99 as of this writing.
Technical indicators:
Major Resistance Levels – $10, $12, $14
Major Support Levels – $8, $6, $4
Polkadot (DOT) Indicator Analysis
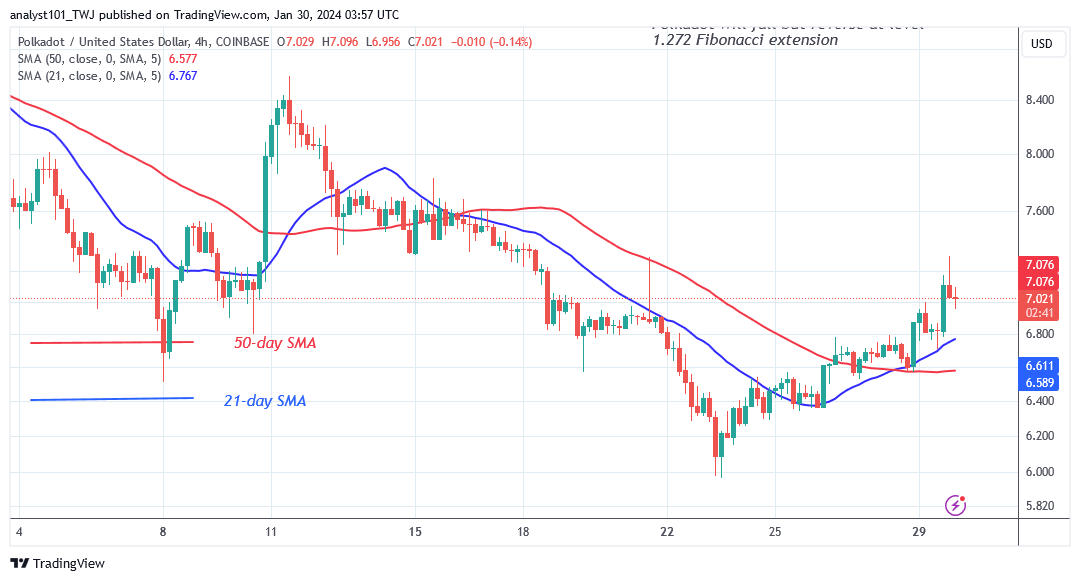
Polkadot is on an upward correction, however the price bars have dropped below the moving average lines following the latest rejection. However, on the 4-hour chart, the price bars are above the moving average lines. This is due to the recent upward move on the upside.
What Is the Next Direction for Polkadot (DOT)?
Polkadot has renewed selling pressure as it faces resistance at $7.29. On the upside, buyers were unable to sustain the price above the moving average lines. This means that Polkadot faces more slide to the downside. The altcoin is now trading between the $6.00 to $7.30 price range. When the range-bound levels are breached, the cryptocurrency will trend.
You can purchase Lucky Block here. Buy LBLOCK
Note: Cryptosignals.org is not a financial advisor. Do your research before investing your funds in any financial asset or presented product or event. We are not responsible for your investing results

