Polkadot Starts Its Decline as It Loses the $6.53 Support
Estimated Reading Time: 2 minutes
Don’t invest unless you’re prepared to lose all the money you invest. This is a high-risk investment and you are unlikely to be protected if something goes wrong. Take 2 minutes to learn more

Polkadot (DOT) Long-Term Analysis: Bearish
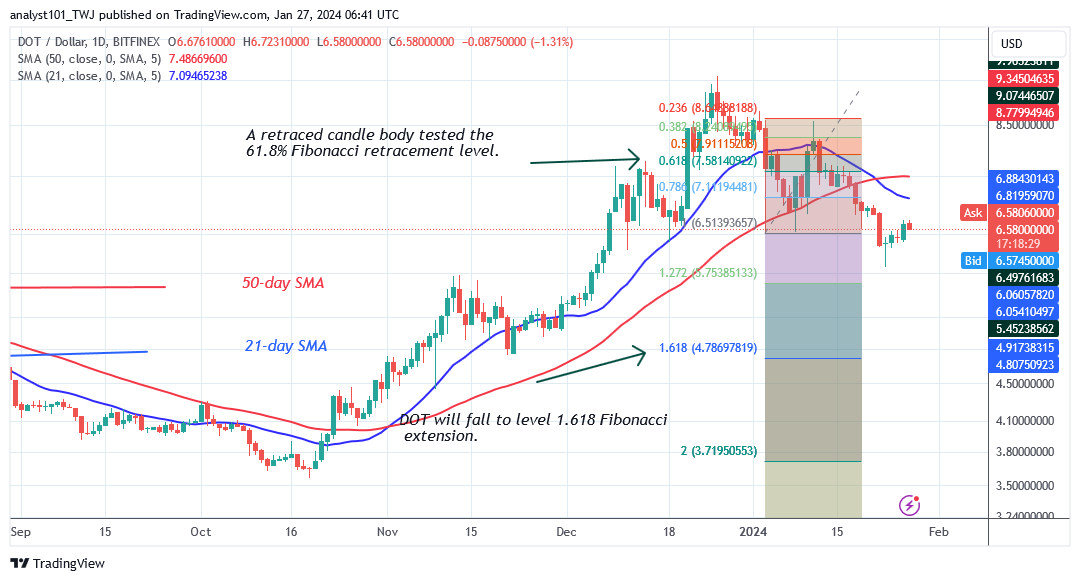
Polkadot (DOT) is in decline below the moving average lines as it loses the $6.53 support. The bears breached the current support at $6.53 and resumed selling pressure. The bulls bought the dips and attempted to resume upward but have been repelled again. The prior support level of $6.53 now acts as resistance to the upward movement.
Nonetheless, the price indicator has predicted a possible decline in the cryptocurrency. On the downside, the price indicator has predicted that DOT will fall to level 1.618 Fibonacci extension or level $4.78. Today, Polkadot is trading at $6.58 at the time of writing. In the meantime, the altcoin is falling as it approaches the predicted price level.
Technical indicators:
Major Resistance Levels – $10, $12, $14
Major Support Levels – $8, $6, $4
Polkadot (DOT) Indicator Analysis
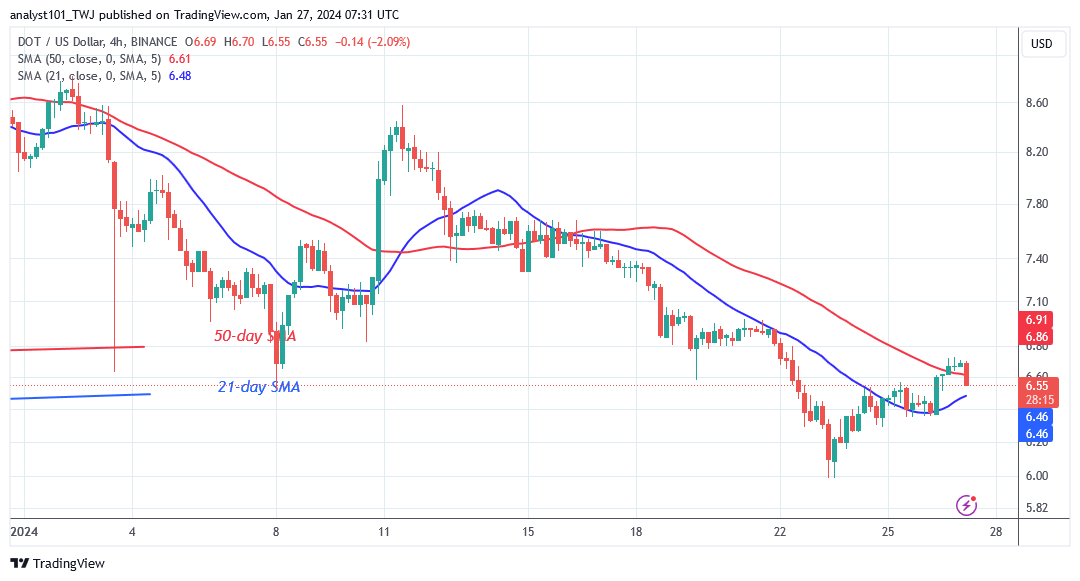
Polkadot has resumed its plunge, with price bars below the moving average lines breaching the existing support. On the 4-hour chart, the price bars have shifted between the moving average lines. This will cause the cryptocurrency to oscillate between the moving average lines.
What Is the Next Direction for Polkadot (DOT)?
Polkadot fell to a low of $5.99 on January 23, 2024, as it lost the $6.53 support. The bears had previously breached the current support at $6.53, causing the latest fall. The upward correction is being rejected again at the recent high. The recent rejection indicates that crypto signals will remain pessimistic. The price indicator reflected the cryptocurrency’s bearishness.
You can purchase Lucky Block here. Buy LBLOCK
Note: Cryptosignals.org is not a financial advisor. Do your research before investing your funds in any financial asset or presented product or event. We are not responsible for your investing results