Polkadot Drops as It Returns to Its Prior Low of $6.53
Estimated Reading Time: 2 minutes
Don’t invest unless you’re prepared to lose all the money you invest. This is a high-risk investment and you are unlikely to be protected if something goes wrong. Take 2 minutes to learn more

Polkadot (DOT) Long-Term Analysis: Bearish
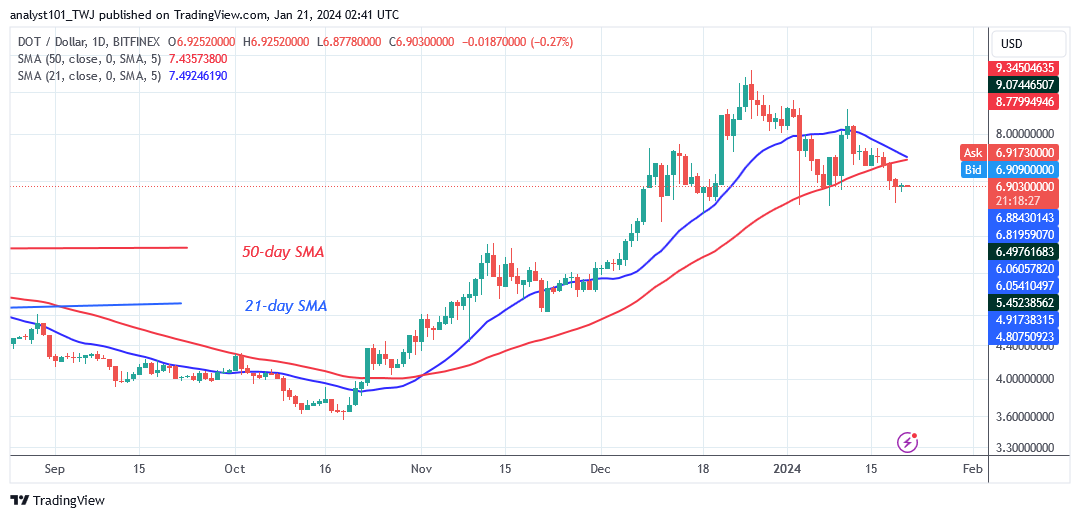
Polkadot (DOT) is trading lower than the moving average lines as it returns to its prior low of $6.53. The cryptocurrency got caught between the moving average lines during the previous price activity. On January 18, the bears broke below the 50-day SMA, resuming selling pressure. The decline was $6.72 by the time this was written.
The previous low of $6.53 is expected to be achieved by the market. However, the altcoin has been reverting since December 11, 2023, when it reached a support level above $6.24. The drop might undo itself in this way at the current $6.53 support level. However, if the bears violate the current support level of $6.53, the market will fall much deeper to $5.87 or lower.
Technical indicators:
Major Resistance Levels – $10, $12, $14
Major Support Levels – $8, $6, $4
Polkadot (DOT) Indicator Analysis
The price bars have dropped below the moving average lines, indicating that the altcoin is once again under selling pressure. Sellers are driving the coin to retest its January 3, 2024 price of $6.53. The moving average lines are sloping down, indicating a downtrend. Polkadot shows a bearish crossover, with the 21-day SMA crossing below the 50-day SMA.
What Is the Next Direction for Polkadot (DOT)?
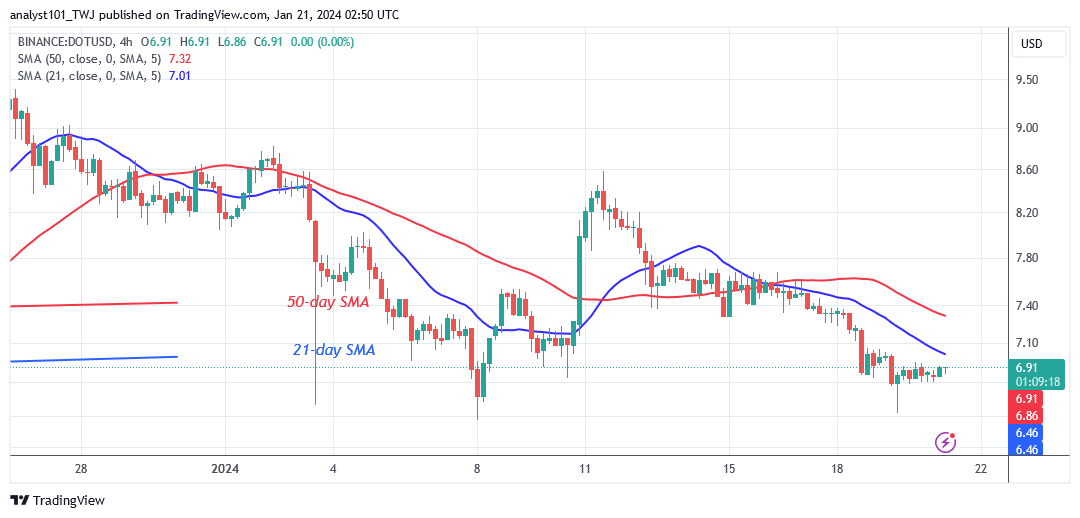
Polkadot is declining as it returns to its prior low of $6.53 . Following the January 3 price dip, the DOT price reversed higher but was stalled around the $8.50 mark. This yields the current price range of $6.53 to $8.50. The altcoin will trend once the current price levels are breached.
You can purchase Lucky Block here. Buy LBLOCK
Note: Cryptosignals.org is not a financial advisor. Do your research before investing your funds in any financial asset or presented product or event. We are not responsible for your investing results