Chainlink (LINK) Holds above $15.05, Resumes Upward Move
Estimated Reading Time: 2 minutes
Don’t invest unless you’re prepared to lose all the money you invest. This is a high-risk investment and you are unlikely to be protected if something goes wrong. Take 2 minutes to learn more
Chainlink (LINK) Long-Term Analysis: Bearish
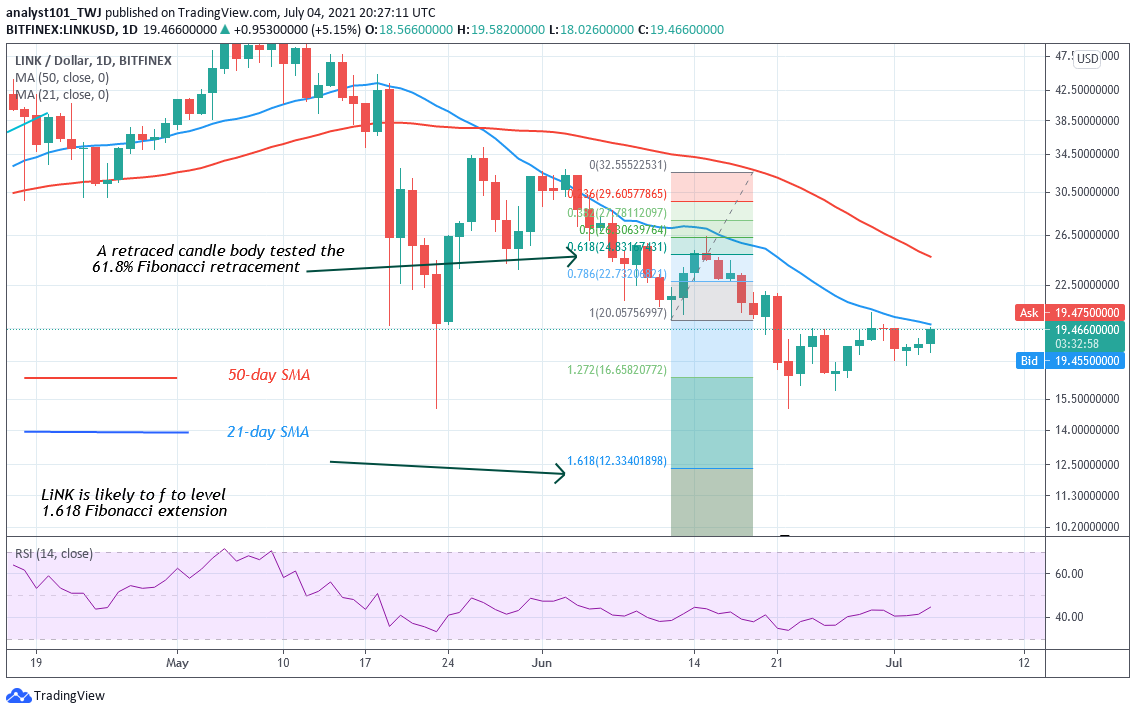
Following the bearish impulse on June 22, Chainlink (LINK) drops to the previous low above $15.07. The bulls bought the dips as price resumes consolidation above the current support. LINK is fluctuating between levels $16 and $20 high. However, the price fluctuation has not gone beyond the current range. On the upside, if buyers break the $20 high, the crypto will rise to retest the $26 resistance. On the downside, the $15 support has been holding since January 2021. Meanwhile, on June 12 downtrend; a retraced candle body tested the 61.8% Fibonacci retracement level. The retracement indicates that LINK is likely to fall to level 1.618 Fibonacci extension or level $12.33.
Chainlink (LINK) Indicator Analysis
LINK is at level 43 of the Relative Strength Index period 14. Chainlink is in the downtrend zone and below the centerline 50. The 21-day SMA and 50-day SMA are sloping southward indicating the downtrend. The crypto is above the 80% range of the daily stochastic. It indicates that LINK has reached the overbought region of the market.

Technical indicators:
Major Resistance Levels – $60, $62, $ 64
Major Support Levels – $30, $28, $26
What Is the Next Direction for Chainlink (LINK)?
Chainlink is in an upward move. It is currently facing rejection at the high of $20. On July 3 uptrend; a retraced candle body tested the 61.8% Fibonacci retracement. The retracement indicates that LINK is likely to rise to level 1.618 Fibonacci extension or level $19.77. From the price action, the crypto has resumed an upward move to reach the targeted price of $19.77.

You can purchase crypto coins here. Buy Tokens
Note: new.cryptosignals.org is not a financial advisor. Do your research before investing your funds in any financial asset or presented product or event. We are not responsible for your investing results