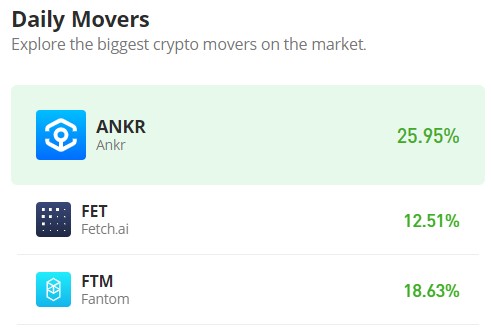
Fetch.ai (FET/USD) Faces Uphill Battle as Bears Emerge Above $2.50
Estimated Reading Time: 3 minutes
Don’t invest unless you’re prepared to lose all the money you invest. This is a high-risk investment and you are unlikely to be protected if something goes wrong. Take 2 minutes to learn more
Fetch.ai (FET/USD) initiated a bullish trend in mid-February, breaking free from the consolidation phase around the $0.60 price level. Since then, the market has exhibited significant gains, steadily conquering higher price points.
The recent surge past major resistance levels has bolstered investor confidence and attracted further buying pressure. However, yesterday’s and today’s strong bullish momentum may have triggered some profit-taking, potentially indicating a potential reversal with bearish positions emerging above the $2.500 level.
Fetch.ai Market Data
- FET/USD Price Now: $2.573
- FET/USD Market Cap: $2.1 million
- FET/USD Circulating Supply: 835 million
- FET/USD Total Supply: 1.2 billion
- FET/USD CoinMarketCap Ranking: #52
Key Levels
- Resistance: $3.00, $3.50, and $4.00.
- Support: $2.00, $1.50, and $1.00.
Fetch.ai Market Analysis: The Indicators’ Point of View
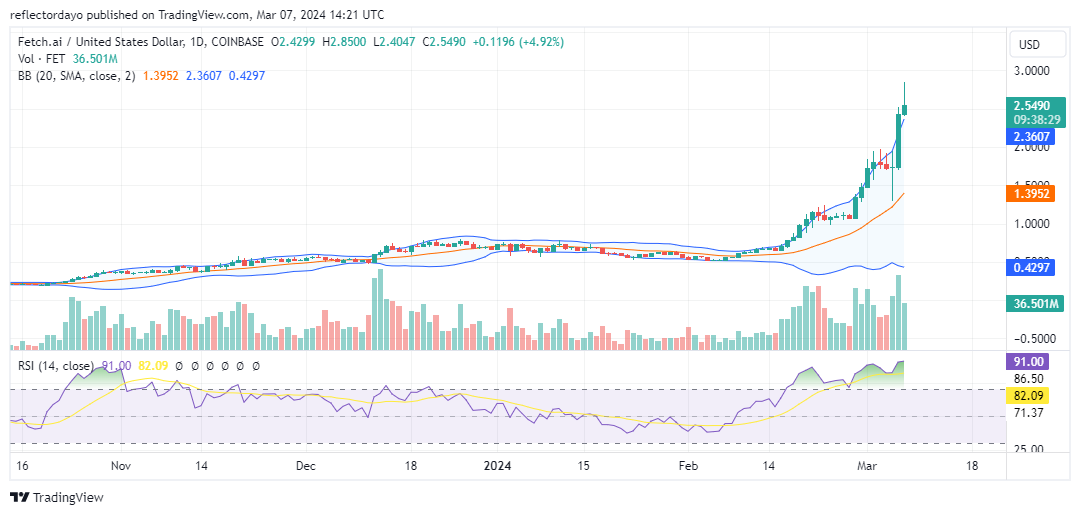
Technical indicators warrant closer inspection. Notably, the Bollinger Bands display an interesting dynamic. While the upper Bollinger Band and the 20-day moving average have ascended alongside the price increase, the lower Bollinger Band remains flat. This divergence could suggest a potential trend reversal.
Furthermore, today’s candlestick formation with a significant upper shadow indicates the emergence of selling pressure above the $2.50 level. While the sustained upward movement of the upper band and moving average typically implies a continuation of the uptrend, the lower band’s deviation is noteworthy.
It’s worth mentioning that the lower band attempted an upward trajectory in late February and early March but ultimately reverted to a sideways movement. This behavior could be attributed to temporary bearish resistance that ultimately proved unsustainable.
Additionally, the Relative Strength Index (RSI) suggests an overbought market, and this crypto signal further hints at the possibility of a correction.
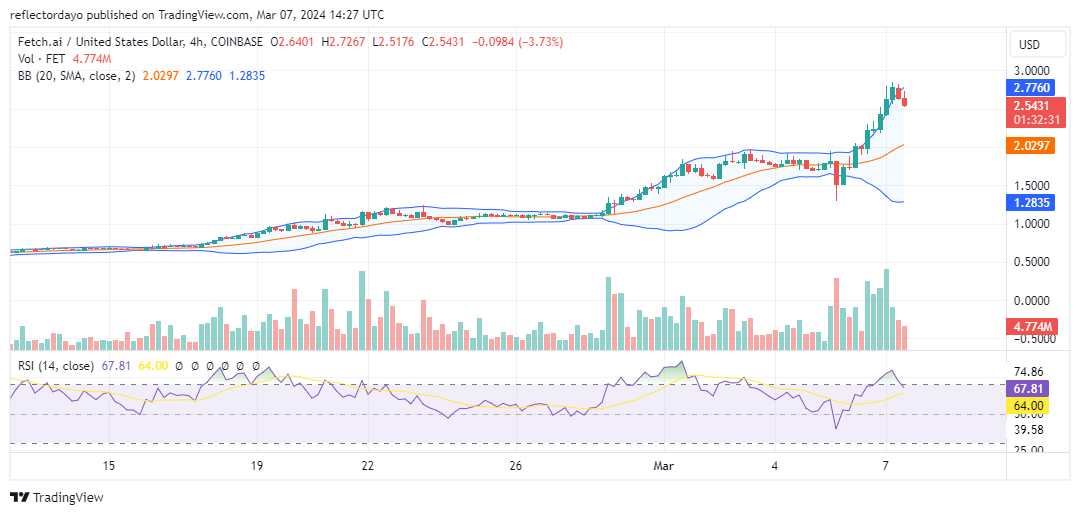
FET/USD 4-Hour Chart Outlook
However, a shorter-timeframe analysis suggests a potential pivot point around the $2.50 level. If bulls can establish support at this level, the Fetch.ai market may undergo consolidation before a clear directional bias emerges.
Interestingly, declining trading volume coincides with the price approaching the $2.50 level, potentially supporting the consolidation possibility.