SPONGE/USD ($SPONGE) Bulls Striving for Stability at the $0.0001127 Price Level
Estimated Reading Time: 3 minutes
Don’t invest unless you’re prepared to lose all the money you invest. This is a high-risk investment and you are unlikely to be protected if something goes wrong. Take 2 minutes to learn more
The $SPONGE market encountered resistance for an extended period in its attempt to breach the $0.0001173 level. Nevertheless, at the commencement of today’s trading session, buying interest waned, yielding to selling pressure and leading to a substantial decline in price. As the bears persisted in breaching additional support levels, the $0.0001127 threshold may possible emerge as a pivotal level where a potential market rebound may occur.
Key Price Levels
- Resistance: $0.000115, $0.000120, and $0.000125.
- Support: $0.000090, $0.000080, and $0.000085.
SPONGE/USD ($SPONGE) Price Analysis: Technical Insights
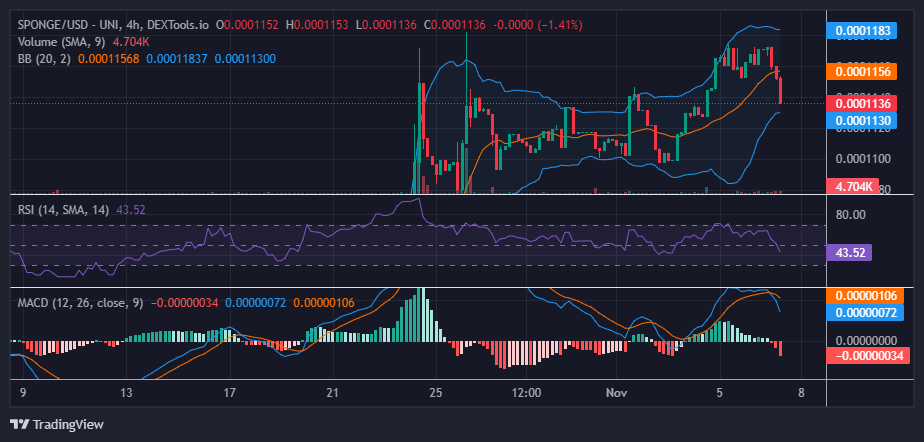
The bearish candlesticks exhibit characteristics akin to a Marubozu candle, albeit with slight shadows, underscoring the prevailing bearish market sentiment. The Moving Average Convergence and Divergence (MACD) further validates the intensity of the selling pressure in $SPONGE market, evident in the rapid divergence following the crossover of the MACD line and the signal line, as depicted by the substantial negative histogram.
However, it is worth noting that the Bollinger Bands indicator suggests that the robust bearish movement has not substantially impacted the Bollinger Bands’ price channel portrayal. The $0.001127 price level appears to serve as a potential support level, potentially facilitating a price rebound.
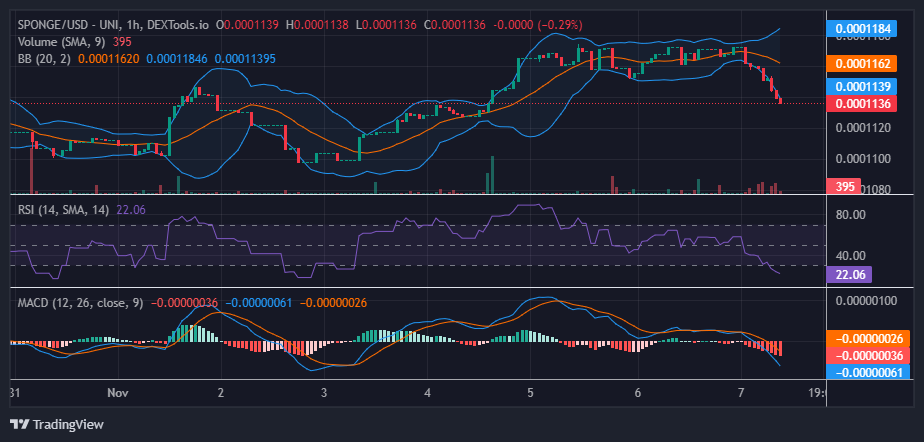
Short-Term Outlook: 1-Hour Chart
Examining the 1-hour chart, a notable observation is the substantial divergence of the Bollinger Bands concurrent with a downward market breakout. This recent market development signifies an escalation in volatility and market interest, potentially setting the stage for a substantial bullish surge upon reaching the $0.0001127 support level.
Another factor supporting the anticipation of a price movement around the $0.0001127 level is the Relative Strength Index (RSI), which currently registers at 22.06, indicative of an oversold condition. This oversold reading on the RSI may contribute to the resurgence of bullish sentiment around the $0.0001127 level.
The distribution of the $SPONGE airdrop has concluded.
🚨 Exciting news, #SPONGERS! 🧽
The $SPONGE Airdrop distribution is now complete! https://t.co/iMAdfg9SiS
Check your wallets to see if you’ve made a splash as one of the recipients! 🌊💰#SPONGE #MemeCoin #Airdrop pic.twitter.com/yw7RKVtcg9
— $SPONGE (@spongeoneth) November 7, 2023
Invest in the hottest and best meme coin. Buy Sponge ($SPONGE) today!