Synthetix (SNXUSD) Continues to Gain Bullish Momentum in Consolidation
Estimated Reading Time: 3 minutes
Don’t invest unless you’re prepared to lose all the money you invest. This is a high-risk investment and you are unlikely to be protected if something goes wrong. Take 2 minutes to learn more
SNXUSD Analysis – Price Continues to Gain Bullish Momentum in Consolidation
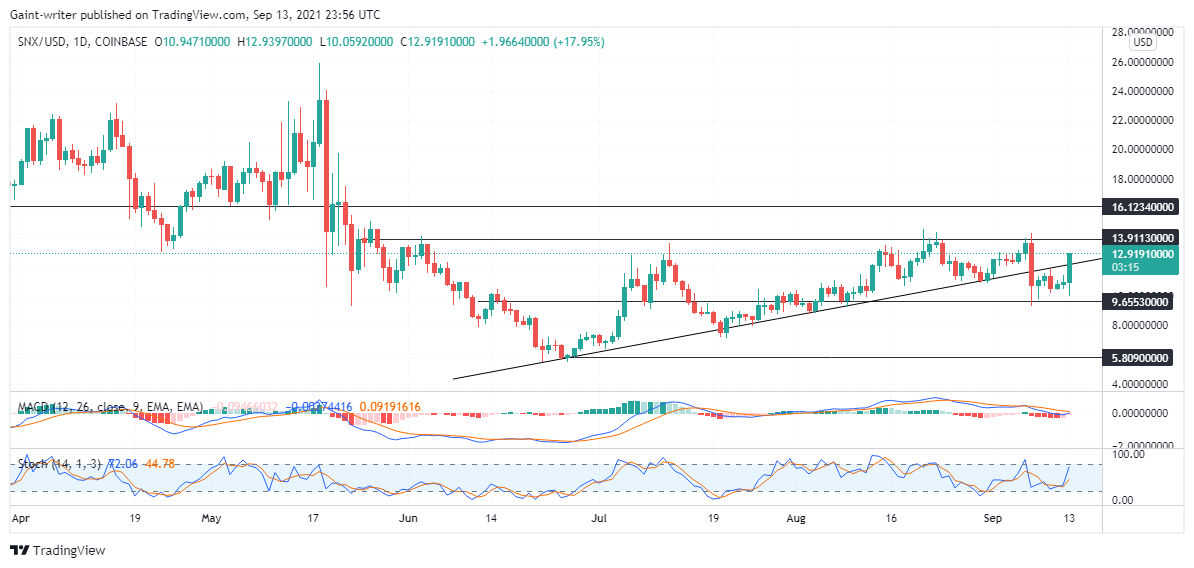
SNXUSD continues to gain bullish momentum as the market keeps consolidating. Price reactions are seen between two significant key levels of $13.900 and $9.650. This is due to the inherent battle between the bulls and the bears. The market, however, continues to retest these levels and keep the accumulation price before breaking out. This break-out can be upward as a result of bullish momentum. This, however, will cause the market to continue in its previous trend.
SNXUSD Significant Levels
Resistance Levels: $16.000, $13.900
Support Levels: $9.650, $5.800
Before the market’s consolidation, the price was initially responding at $16.000. The key level was subsequently breached by a huge bear candle, indicating that the market had entered a downtrend. After that, the price broke through two important key levels of $13.900 and $9.650 before reversing at $5.800. As the upswing begins, the bulls seize control of the market.
SNXUSD continues to make new highs as the market begins to break previous significant key levels. The market also assumes a trend line channel as it continues to retest it. The price is currently in the consolidation period, as the bulls and bears continue to battle for dominance. The Stochastic Oscillator indicator depicts the market as it gains momentum. Near the overbought zone, the Oscillator is going to produce a golden cross.

Market Predictions
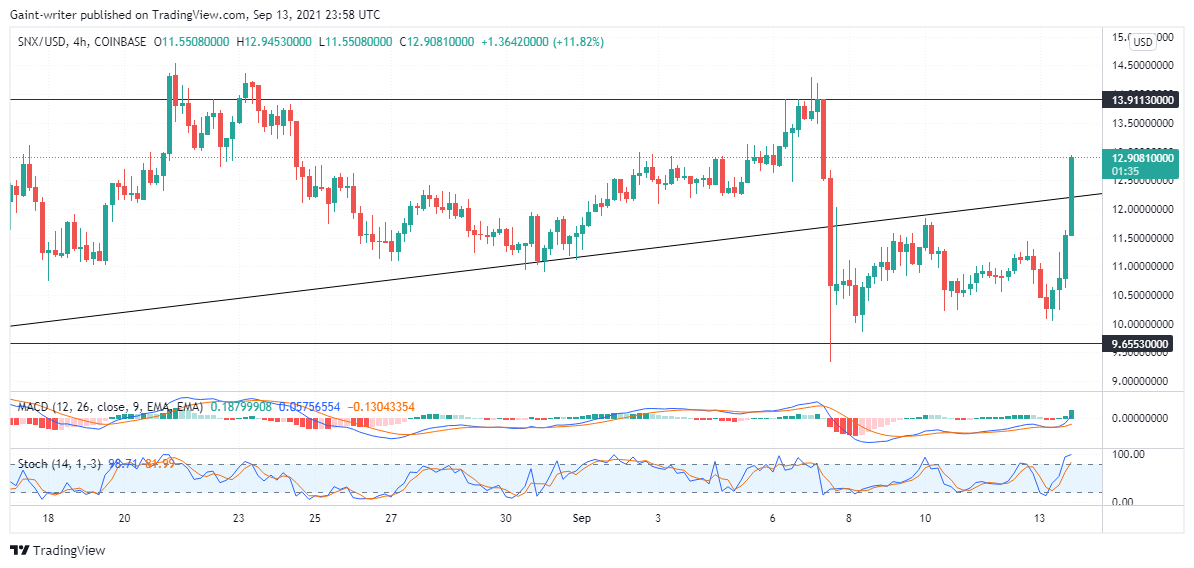
On the 4hour chart, the price is seen in the consolidation phase. The bulls and bears continue to make sharp liquidity runs between the two significant key levels. The MACD (Moving Average Convergence and Divergence) indicator shows price remains below the zero level and the green histogram bars continue to rise. This indicates that the bulls are still in control. The Stochastic Oscillator also shows price movement around the overbought region. This shows that the bullish ride is almost over in the consolidation phase. The market is likely to reverse after getting to $13.900 before it then rallies up again.
You can purchase crypto coins here: Buy Tokens
Note: Cryptosignal.org is not a financial advisor. Do your research before investing your funds in any financial asset or presented product or event. We are not responsible for your investing results.