Quant Price Prediction: QNT/USD Prepares for an Upward Move
Estimated Reading Time: 3 minutes
Don’t invest unless you’re prepared to lose all the money you invest. This is a high-risk investment and you are unlikely to be protected if something goes wrong. Take 2 minutes to learn more
Quant Price Prediction – September 27
The Quant price prediction suggests that a bullish momentum surge could propel the market price toward the upper boundary of the channel.
QNT/USD Medium-term Trend: Bearish (1D Chart)
Key Levels:
Resistance levels: $95, $100, $105
Support levels: $80, $75, $70
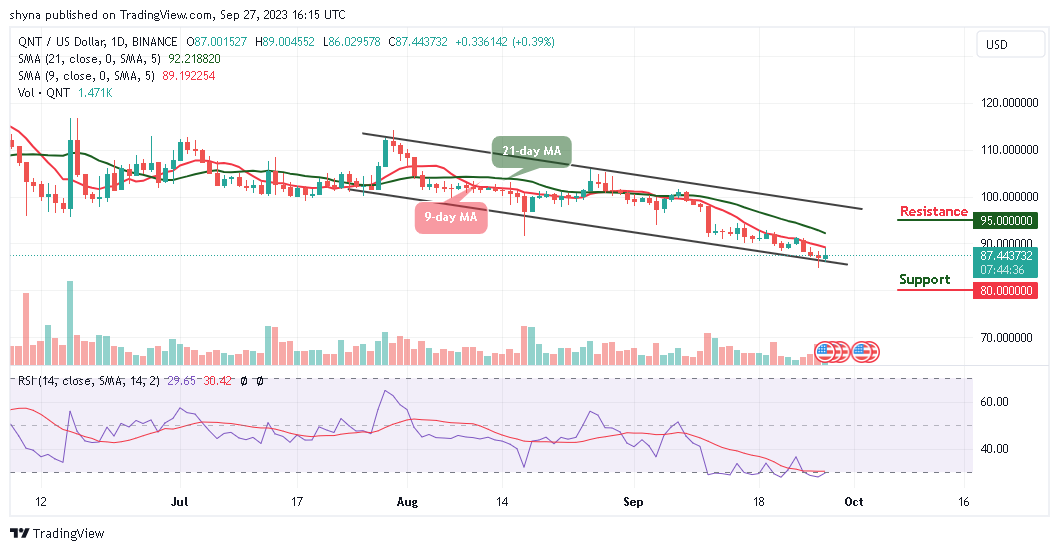
QNT/USD is currently trending bearish, hovering below the 9-day and 21-day moving averages. However, the potential for a bullish upswing remains if the bulls can gather enough strength to push the price toward the $90 resistance level. Meanwhile, a failure to drive the price upward may lead to a retreat before the coin can attempt another upward move.
Quant Price Prediction: QNT/USD Gearing Up for Bullish Momentum
The current Quant price hovers around $87.4 as it prepares for a potential bullish surge. To confirm this bullish outlook, the price is expected to cross above the 9-day and 21-day moving averages. If successful, it could target the resistance levels of $95, $100, and $105 by breaking above the upper boundary of the channel. On the other hand, failure to push the coin upside could result in a dip below the lower boundary of the channel, prompting support levels at $80, $9750, and $70 to attract more buyers. The Relative Strength Index (14) remains below the 30-level, suggesting potential upward movement.
QNT/USD Medium-term Trend: Bearish (4H Chart)
On the 4-hour chart, the Quant price is currently within the 9-day and 21-day moving averages. The Relative Strength Index (14) is moving below the 40-level, suggesting more bearish signals. This could be an opportunity for buyers to prepare for an impending upward movement, potentially making it an opportune time for investors to consider buying the dip. A bullish breakout may drive the coin toward the upper channel boundary, targeting the resistance level at $91 and above.
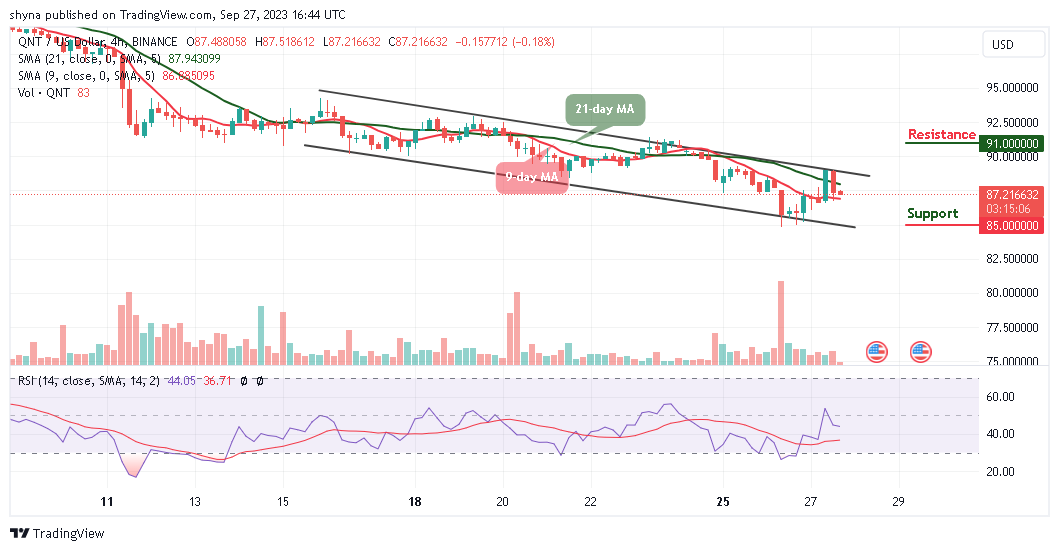
However, caution should be exercised as a bearish scenario might unfold if the price crosses below the lower channel boundary. In such a case, a critical support level of $85 and below may come into play. Because of the price’s short-term movements, the present moment is considered favorable for sellers, as bearish momentum could bring the coin downwards.
Place winning Quant trades with us. Get QNT here