Quant Price Prediction: QNT/USD Slows Down Below $93.0 Level
Estimated Reading Time: 3 minutes
Don’t invest unless you’re prepared to lose all the money you invest. This is a high-risk investment and you are unlikely to be protected if something goes wrong. Take 2 minutes to learn more
Quant Price Prediction – September 14
The Quant price prediction shows that QNT may head to the downside to locate the next support at $90.0 before making another breakout.
QNT/USD Long-term Trend: Bearish (Daily Chart)
Key levels:
Resistance Levels: $100, $102, $104
Support Levels: $84, $82, $80
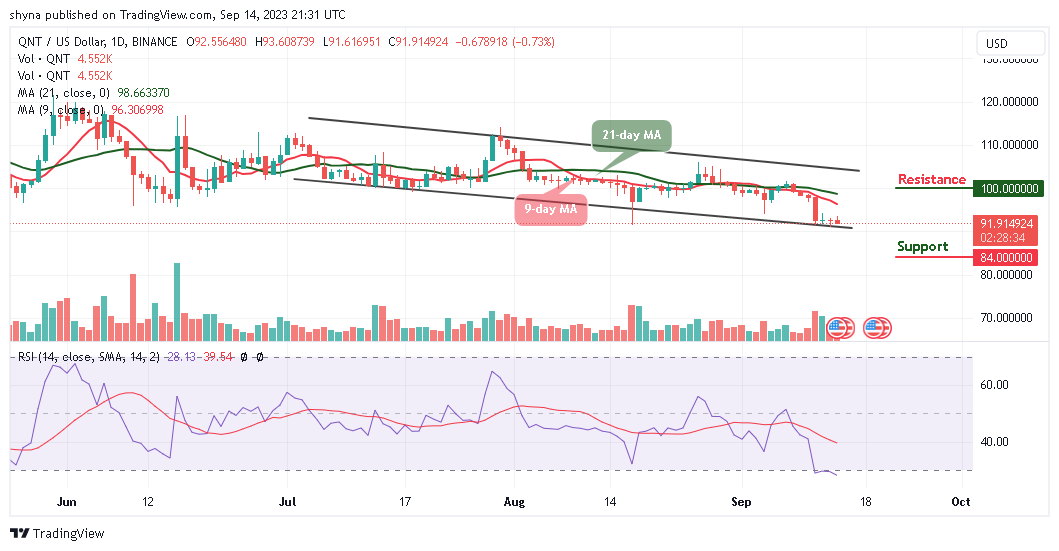
QNT/USD is slightly down today after struggling to hold above the resistance level of $92.5. This comes following a few bearish days as the bears increase the pressure, hitting as low as $91.6 on the daily chart. Earlier today, the Quant price was seen trading above the $93.0 level but quickly reversed back down below the next major support level at the $91 level.
Quant Price Prediction: QNT Price May Consolidate
The Quant price keeps hovering at the downside even as bulls seek more support below the 9-day and 21-day moving averages. Looking at the technical indicator Relative Strength Index (14), QNT/USD is still in the hands of the bears. However, a minor retreat made by the technical indicator is making an attempt to trade below the 30-level suggesting that exhaustion is slowly engulfing the bullish tent and whatever direction it chooses would determine the next level for the coin.
Nevertheless, if QNT/USD delays the run-up to $95.0, sellers could eventually gain traction, sending the price to the nearest support at $90. Meanwhile, if the support at $85 is shattered, the Quant (QNT) may be forced to seek refuge in the next key supports at $84, $82, and $80. On the other hand, any bullish movement above the moving averages could hit the potential resistance levels at $100, $102, and $104 respectively.
QNT/USD Medium-term Trend: Bearish (4H Chart)
On the 4-hour chart, the Quant price is trading around the 9-day moving average at the $91.9 level. However, the market price may likely fall toward the lower boundary of the channel if the bears continue to control the market.
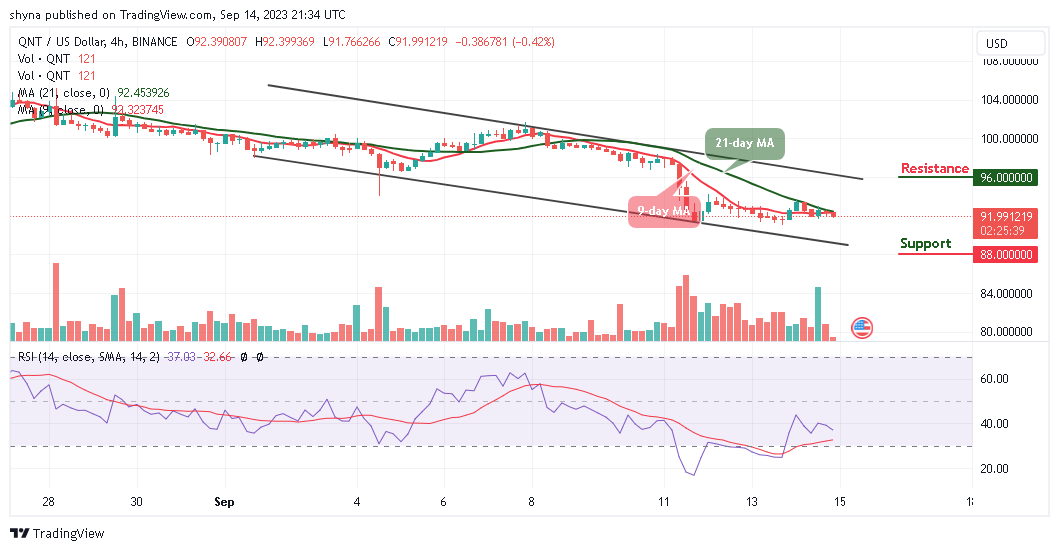
Moreover, a further bearish movement could test the critical support at the $88 level and below while the resistance is located above the upper boundary of the channel at $96 and above. Technically, Quant is currently following a bearish movement as the technical indicator Relative Strength Index (14) moves below the 40-level.
Place winning Quant trades with us. Get QNT here