Quant Price Prediction: QNT/USD Slumps as Price Moves Below $100
Estimated Reading Time: 3 minutes
Don’t invest unless you’re prepared to lose all the money you invest. This is a high-risk investment and you are unlikely to be protected if something goes wrong. Take 2 minutes to learn more
Quant Price Prediction – August 31
Quant price predictions show that QNT is suffering under the influence of the bears as the path of least resistance remains downward.
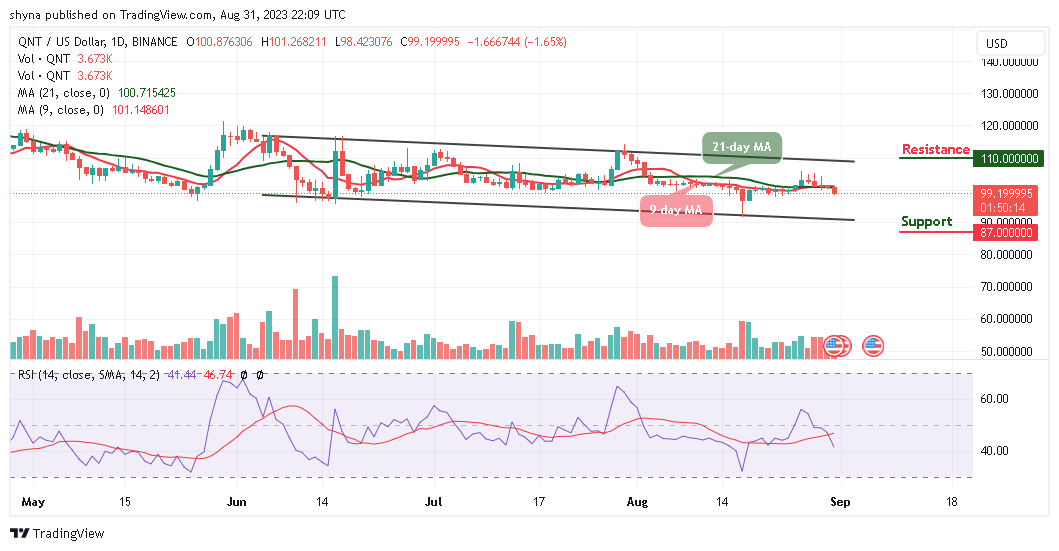
QNT/USD Long-term Trend: Ranging (1D Chart)
Key Levels:
Resistance levels: $110, $112, $114
Support levels: $87, $85, $83
The daily chart reveals that the trading volume is decreasing further as the QNT/USD pair continues to move under the control of bears. The Quant price may slide toward the lower boundary of the channel which could hit the supports at $87, $85, and $83 if the bears increase the pressure. Therefore, it is important to note that QNT/USD market remains on a short-term downtrend trading below the 9-day and 21-day moving averages.
Quant Price Prediction: QNT Could Head Lower
The Quant price may continue to head to the downside while bullish control could move toward the upper boundary of the channel. However, if buyers can return to the market, the coin could reach the resistance levels of $110, $112, and $114 may come into play. On the contrary, a surge of volatility may come into play as the technical indicator Relative Strength Index (14) moves to cross below the 40-level, suggesting a further drop in prices within the market.
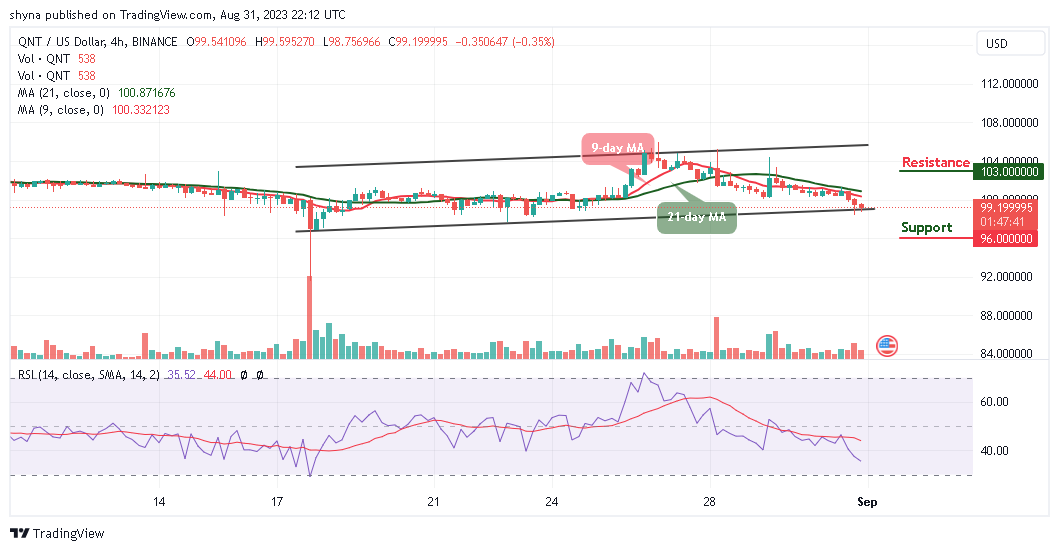
QNT/USD Medium-term Trend: Ranging (4H Chart)
According to the 4-hour chart, Quant is likely to cross below the lower boundary of the channel as the price action continues below the 9-day and 21-day moving averages. Now, the Quant price appeared non-volatile heading to the downside, signaling a bearish surge in the market. As it is now, the QNT price is likely to go down to the support level of $96 and below if the bulls fail to hold the current market value.
However, a bullish regroup may bring a decisive move with a potential break above the 9-day and 21-day moving averages. If such a scenario occurs, the Quant price may likely go as high as $103 and above. On the long-term outlook, the QNT price remains on the upside as a rebound could be possible if the $99 can act strong. Meanwhile, the Relative Strength Index (14) is moving below the 40-level, suggesting bearish signals in the market.
Place winning Quant trades with us. Get QNT here