Litecoin (LTC/USD) Price Hovers at $200
Estimated Reading Time: 3 minutes
Don’t invest unless you’re prepared to lose all the money you invest. This is a high-risk investment and you are unlikely to be protected if something goes wrong. Take 2 minutes to learn more
Litecoin Price Prediction – November 30
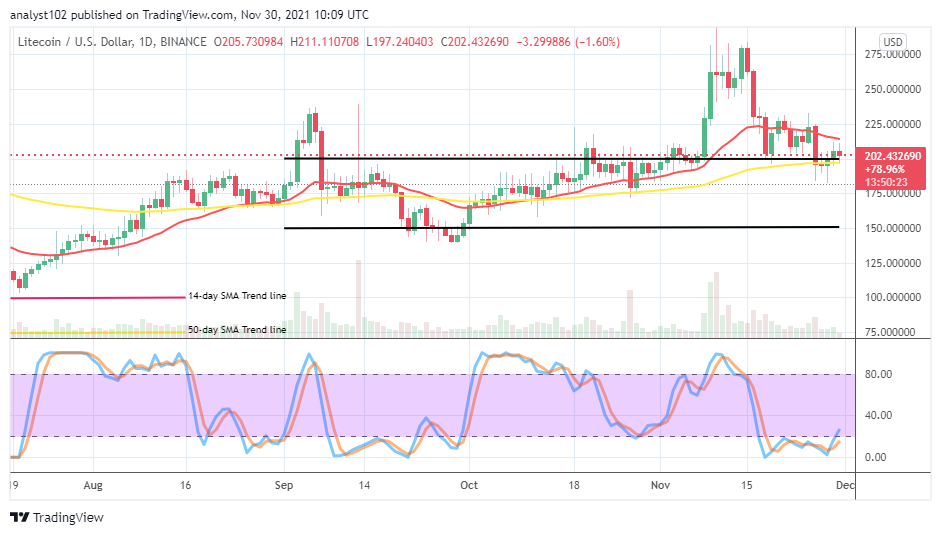
There has been a continual featuring of consolidation moves in the LTC/USD market as the crypto-economic price hovers at $200. The crypto trade percentage rate is estimated at a negative number of 1.60, trading around $202 as of writing.
LTC/USD Market
Key Levels:
Resistance levels: $225, $250, $275
Support levels: $175, $150, $125
LTC/USD – Daily Chart
The LTC/USD daily chart shows that the crypto-economic price hovers around the market trading level of $200. The crypto versus the US Dollar market operations resulted in the current hover-trading situation since it lost momentum further on the 26th session. The 50-day SMA indicator is at the value line, affirming a stronger stance against further smooth down-turning pressures underneath the 14-day SMA indicator. The Stochastic Oscillators are in the oversold region, trying to cross the lines northbound against the range line at 20. That suggests a near possible returning process to the upside.
Will the LTC/USD market dwell more on the $200 level as the crypto-economic price hovers around it?
The dwelling more of the LTC/USD market operations on the $200 level would amount to the fact that the trade is still building up strengths as the crypto-economic price hovers around it. The upper range value line and the mid-range level at $175 now appear to be the focus trading axis presently. Therefore, long-position takers will have to stay alert to observe when there will be active motion emerging from around the lower mid-range trading spot to consider longing their positions.
On the downside of the technical analysis, a full-fledged bearish candlestick needed to occur against $200 to let short-position takers extend their presence in the LTC/USD market activities furthermore. While that assumption plays out, the current range-bound trading outlook may still keep intact. Trading lines beneath the resistance level at $225 may witness difficulties before the price pushes northward further. And a strong reversal motion around it can lead the market back to downsize again.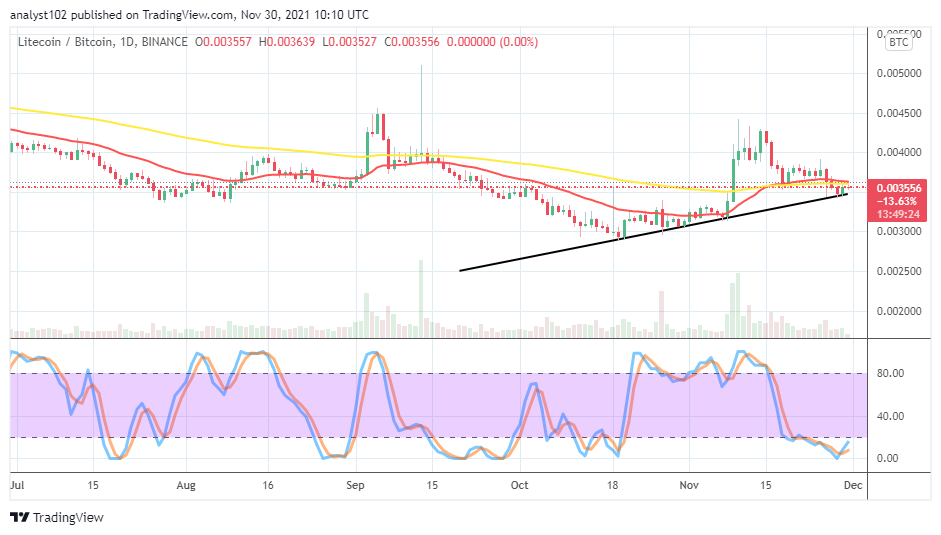
LTC/BTC Price Analysis
In comparison, Litecoin’s trending ability as paired with Bitcoin on the price analysis chart still somewhat reveals that the base crypto isn’t succumbing to many downward pressures. The cryptocurrency pair price hovers around the conjoined trending spot of the trend lines of the SMAs. The 14-day SMA indicator appears tightly above the 50-day SMA indicator in their conjoining pattern. The Stochastic Oscillators are in the oversold region, attempting to cross the lines northbound from the zero-range baseline. That suggests the probability that the base crypto may soon push against its counter-trading crypto.
Note: Cryptosignals.org is not a financial advisor. Do your research before investing your funds in any financial asset or presented product or event. We are not responsible for your investing results.
You can purchase crypto coins here. Buy Tokens