Lucky Block Price Prediction: LBLOCK/USD Price Awaiting a Breakout at $0.0095
Estimated Reading Time: 3 minutes
Don’t invest unless you’re prepared to lose all the money you invest. This is a high-risk investment and you are unlikely to be protected if something goes wrong. Take 2 minutes to learn more

Free Crypto Signals Channel
In case the bulls increase their momentum, it will increase the Lucky Block price prediction to break up the $0.0090 level which will push the price to test at $0.0095 and $0.0100 price levels.
LBLOCK/USD Market
Key Levels:
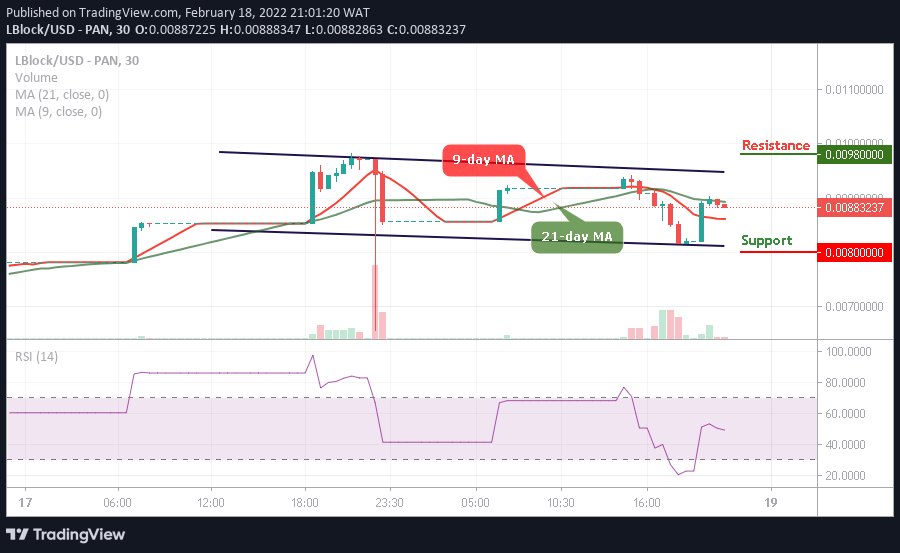
Resistance levels: $0.00980, $0.0103, $0.0108
Support levels: $0.00800, $0.00750, $0.00700
LBLOCK/USD is moving sideways as the market price prepares to cross above the 21-day moving average. Meanwhile, the bullish momentum is propelling the coin above the 9-day moving average as the bullish pressure may prepare to break up the $0.00900 level. However, should the bulls fail to push the price upward, the Lucky block price may consolidate for a while.
Lucky Block Price Prediction: LBLOCK/USD May Consolidate Before Breakout
The Lucky Block price is changing hands at $0.0087 where it retreats slightly. However, if the coin continues the current movement and rebound from above the 9-day moving average, the coin may locate the potential resistance levels at $0.00980, $0.0103, and $0.0108 while the support levels may surface at $0.00800, $0.00750, and $0.00700 respectively which may give the opportunity for the new entries as the technical indicator Relative Strength Index (14) moves above 45-level.
LBLOCK/USD Medium-term Trend: Ranging (15 Minutes Chart)
On the 15-minute chart, the Lucky Block price moves around the 9-day and 21-day moving averages with a bullish candle. Meanwhile, the technical indicator Relative Strength Index (14) would cross above 50-level which may push the coin to the upside. Meanwhile, any further bullish movement towards the upper boundary of the channel could hit the resistance level at $0.00970 and above.
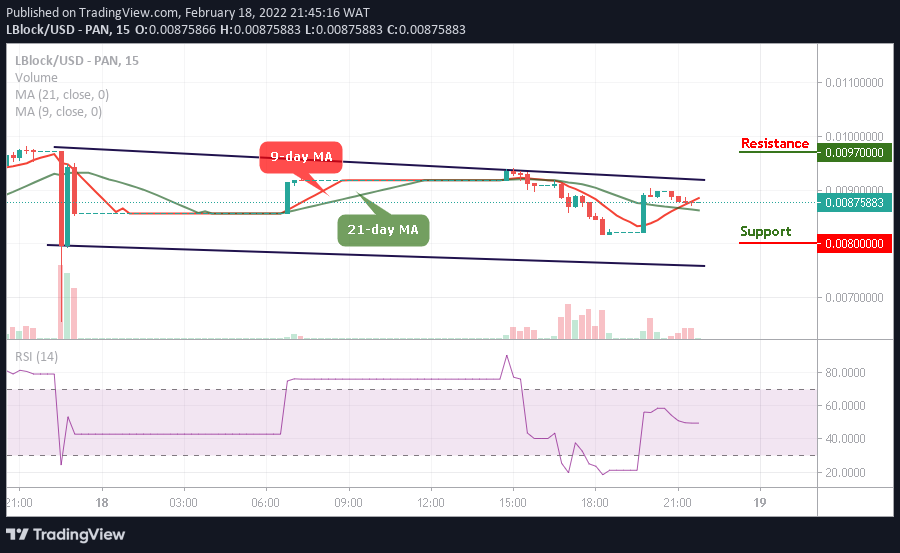
On the contrary, LBLOCK/USD needs to experience more bullish signals and once this happens, the market price may cross above the channel but if the price drop below the market value at $0.00869, it could touch the critical support at $0.00800 and below. The technical indicator Relative Strength Index (14) reveals that the market is preparing to spike as the signal line moves on average.
Read more: