Lucky Block Price Prediction: LBLOCK/USD Hits the Intraday High at $0.0094
Estimated Reading Time: 3 minutes
Don’t invest unless you’re prepared to lose all the money you invest. This is a high-risk investment and you are unlikely to be protected if something goes wrong. Take 2 minutes to learn more

Free Crypto Signals Channel
The Lucky Block price prediction gets ready to clear the resistance level of $0.0100 as the coin remains at the Upside.
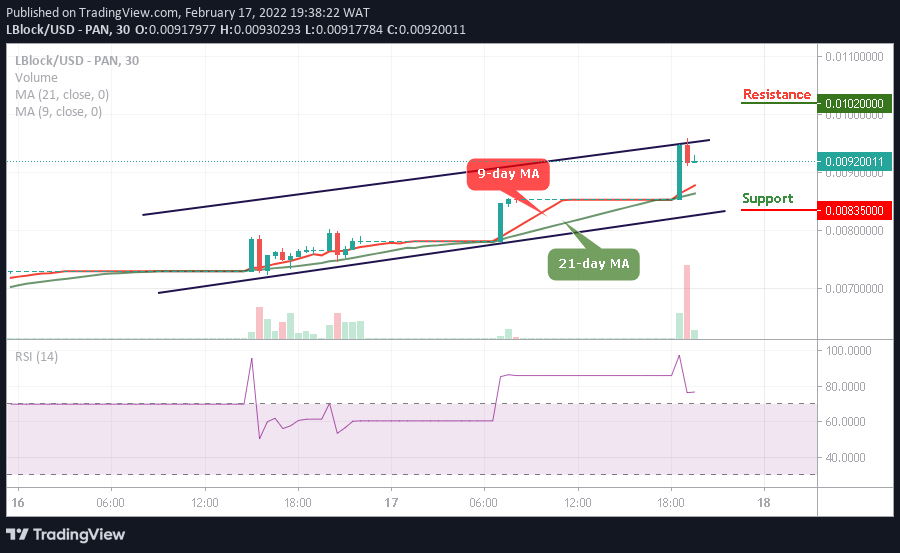
LBLOCK/USD Long-term Trend: Bullish (30 Minutes Chart)
Key Levels:
Resistance levels: $0.0102, $0.0107, $0.0112
Support levels: $0.0083, $0.00778, $0.0073
LBLOCK/USD indicates a tremendous uptrend in the market as the coin moves to break above the upper boundary of the channel after crossing the 9-day and 21-day moving averages. However, the bulls are ready to push the Lucky Block price higher to encourage more buyers into the market.
Lucky Block Price Prediction: More Bullish Signals Are Coming into Focus
At the time of writing, the Lucky Block price moves to cross above the upper boundary of the channel in favor of buyers. Therefore, this would cause the new buyers to come into the market. On the contrary, the coin is likely to hit supports as $0.0083, $0.00778, and $0.0073 but buyers are to buy long immediately this comes to play.
On the upside, considering a continuous upward trend for the Lucky Block, it is going to move above the channel in other to create additional resistance levels at $0.0102, $0.0107, and $0.0112 on a long-term bullish as the technical indicator Relative Strength Index (14) remains within the overbought region.
LBLOCK/USD Medium-term Trend: Ranging (15 Minutes Chart)
On the 15-minute chart, the Lucky Block price is hovering above the 9-day and 21-day moving averages at $0.00.91 level with a little retreat. Therefore, if the coin crosses above the channel, it may push the market to the resistance level of $0.0105 and above.
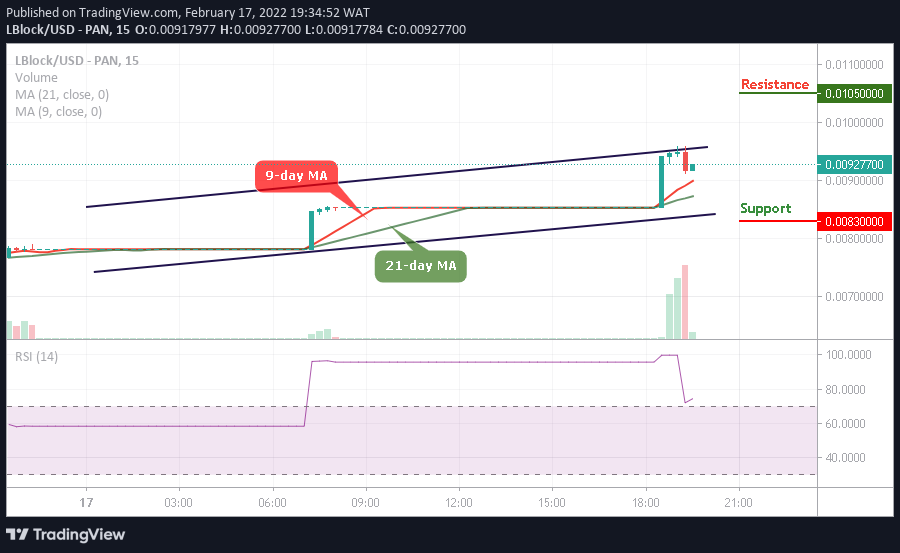
In other words, if the market drops slightly, the support level of $0.0083 and below may surface, and this could be a good signal for the new buyers to buy long while the technical indicator Relative Strength Index (14) keeps moving within the overbought region.
Read more:


