Bitcoin (BTC/USD) Dares to Hover Around the Key $60,000 Resistance Value
Estimated Reading Time: 3 minutes
Don’t invest unless you’re prepared to lose all the money you invest. This is a high-risk investment and you are unlikely to be protected if something goes wrong. Take 2 minutes to learn more
Bitcoin Price Prediction – April 11
The BTC/USD market price has severally continued to contend with the key resistance trading level of $60,000 over a couple of sessions.
BTC/USD Market
Key Levels:
Resistance levels: $65,000, $70,000, $75,000,
Support levels: $50,000, $45,000, $40,000
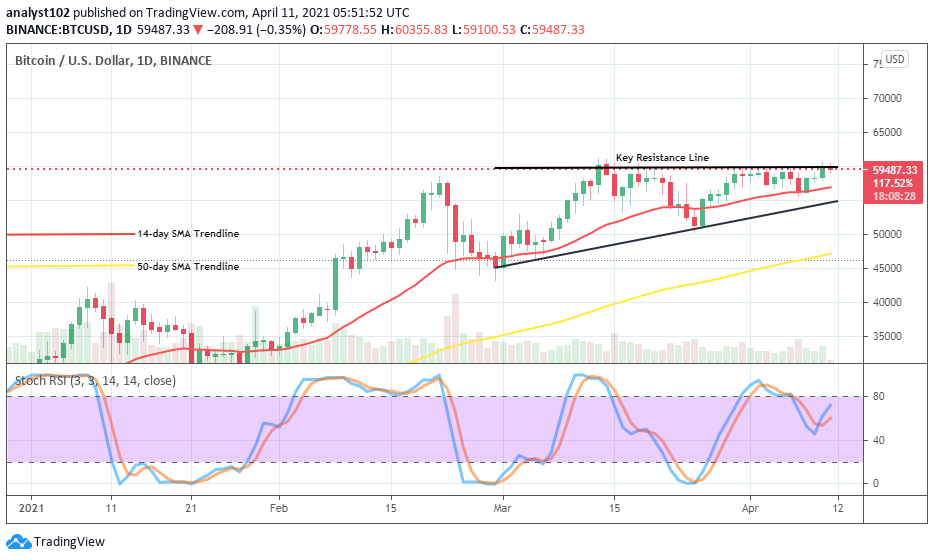
BTC/USD – Daily Chart
The daily trading chart showing the business operations between BTC and the US Dollar maintains that the flagship crypto-s value still moves in a consolidation formation as paired with the fiat currency. Until the present of writing, both the bullish and the 14-day SMA trend-lines are placed underneath the current trading point of the market pointing towards the north. The 50-day SMA indicator is located below them, also pointing towards the north direction. The Stochastic Oscillators have crossed the hairs towards the northbound within ranges of 40 and 80. That signifies that a breakout to the north is imminent.
Will the BTC/USD value breakout over the key $60,000 resistance afterward?
Most of the trading indicators have had it that it is highly in focus that the key resistance trading zone of $60,000 will be breached northwardly in a near session. The BTC/USD bulls have now been beefing up their efforts in a consolidation-moving mode over time. However, a touch of support around the $55,000 line will give a better sense of buy entry while price reverses if that assumption plays out.
On the flip side, as usual, the technical trading approach, the BTC/USD bears will have to wait for a price rejection confirmation signal during an active action at a higher market level. In the meantime, a forceful breakdown of the support line at $55,000 will signal to feature of downs which may live on a short note. That said, the $50,000 level stands to be the last point that bears may push in a sudden downward move.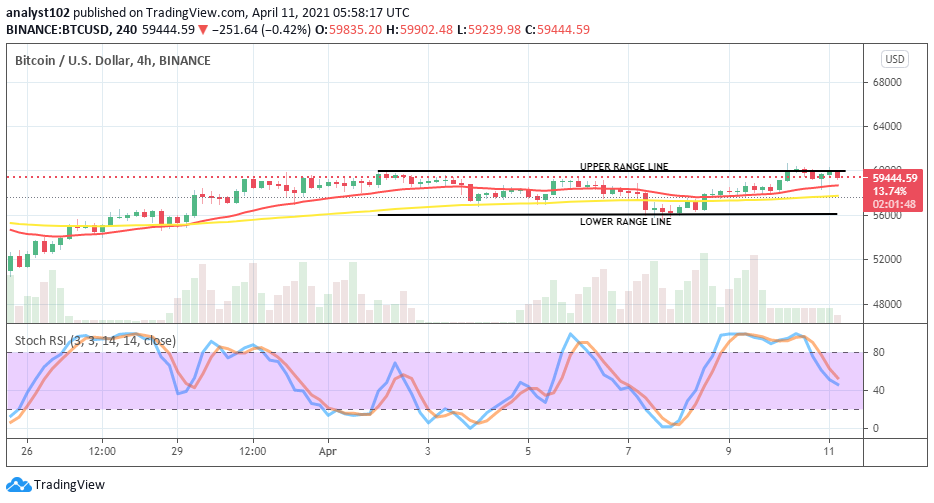
BTC/USD 4-hour Chart
It has still been featuring on the BTC/USD 4hour trading chart that between April 2 and 8 trading days’ sessions, price has traded around the upper range value of $60,000 and the lower range value of $56,000 until the present. The 14-day SMA trend-line is a bit on top of the 50-day SMA indicator. And, they are both in the range trading price levels as earlier mentioned. The Stochastic Oscillators have slantingly moved from the overbought region to seemingly attempt to cross the hairs to the north around range 40. That gives a sign that there may soon be a return of buying moves in the crypto-economy in the near time.
Note: cryptosignals.org is not a financial advisor. Do your research before investing your funds in any financial asset or presented product or event. We are not responsible for your investing results