Uniswap (UNI/USD) Market Trades in a Relative Bullish Reversal Pattern
Estimated Reading Time: 3 minutes
Don’t invest unless you’re prepared to lose all the money you invest. This is a high-risk investment and you are unlikely to be protected if something goes wrong. Take 2 minutes to learn more
Uniswap Price Prediction – April 8
There has been an ongoing bullish reversal movement in the UNI/USD trading operations as price trades around the mid-point levels of $35 and $25 currently.
UNI/USD Market
Key Levels:
Resistance levels: $35, $40, $45
Support levels: $20, $15, $10
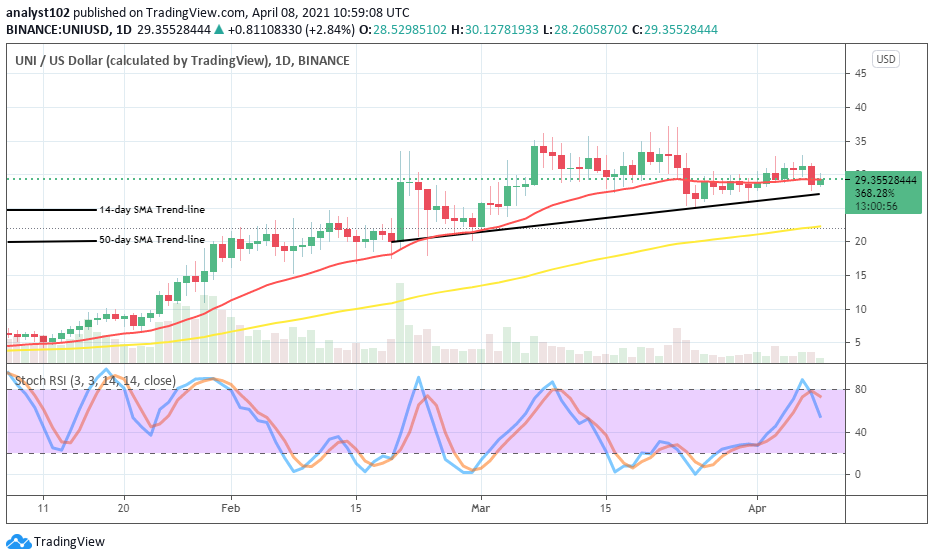
UNI/USD – Daily Chart
On the UNI/USD daily trading chart, it is depicted that the UNI/USD bullish move now experiences series of lower highs after the value hit a resistance point around $35. In the meantime, the 14-day SMA trend-line is seen swinging along with the current market trading level closer over the bullish trend-line. And, the 50-day SMA indicator is situated underneath them a bit below the $25 price level. The Stochastic Oscillators have crossed at range 80 to slightly point towards the south. That shows a degree of selling spree is on in the crypto-economy.
Will there soon be a change in the trading direction of UNI/USD?
As the $35 and the $25 important levels have been observed to be the potential range-bound trading points, the UNI/USD bulls will be expected to either muster up their strength from the $25 lower range line or intensify their stance at the presumed upper range line of $35 in a near session to be able to give a new higher outlook performance of the crypto-trade beyond the last high value achieved initially.
On the flip side, the bears will have to be on the lookout for a new round of price resistance area around the presumed upper range line of $35 before considering a sell entry. A sudden breakdown of the $25 level may let in the revisit of a lower value around the $20. If that assumption eventually plays accordingly, further placing of sell positions will have to put on hold to avoid being getting trapped.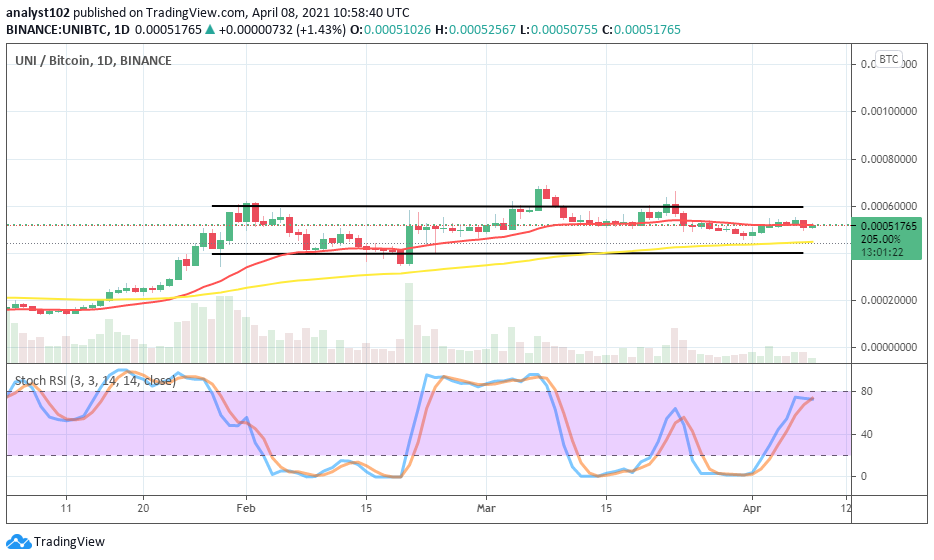
UNI/BTC Price Analysis
Taking a look at the market worth between UNI and BTC, after a northward push by the base crypto against its counter instrument, there has been a long flat trading trend in the operations. The 14-day SMA trend-line is above the 50-day SMA trend-line as they both point towards the east direction. Also, price moves are characterized by variant lower highs around the smaller SMA. That shows that a range move is going on in the market. Therefore, neither the bull nor the bear has been able to push the price in a distinct direction currently. The stochastic Oscillators are seemingly attempting to cross the hairs near below range 80. That could be a signal of seeing a bit higher lows in the next session.
Note: cryptosignals.org is not a financial advisor. Do your research before investing your funds in any financial asset or presented product or event. We are not responsible for your investing results.