Cardano Oscillates within a Range as It Aims the $0.42 High
Estimated Reading Time: 2 minutes
Don’t invest unless you’re prepared to lose all the money you invest. This is a high-risk investment and you are unlikely to be protected if something goes wrong. Take 2 minutes to learn more
Cardano (ADA) Price Long-Term Forecast: Bearish
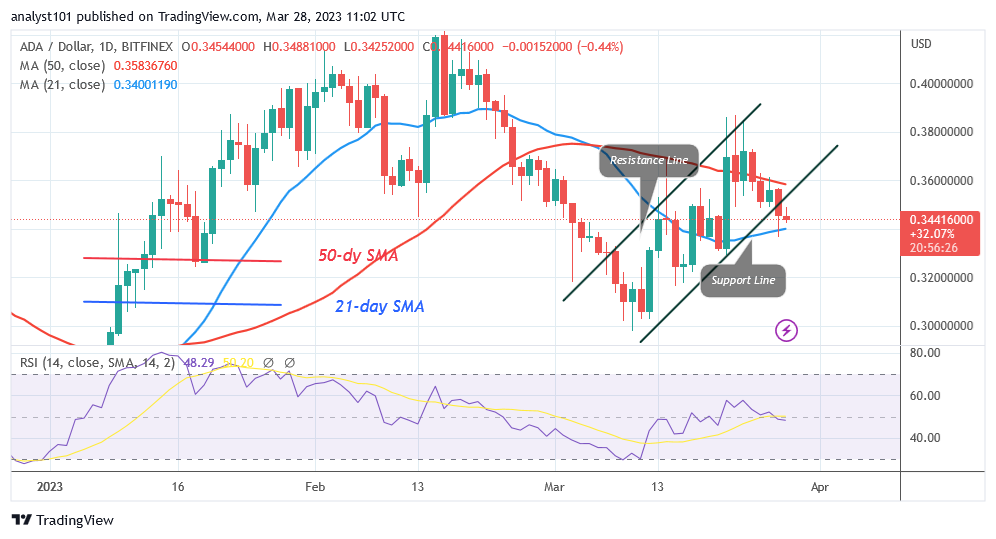
The price of Cardano (ADA) is rising as it aims at the $0.42 high. The value of the cryptocurrency at the time of writing was $0.34. The price indicator predicts that the altcoin will decrease to a level of $0.338. ADA is currently entrapped within the moving average lines. If the price falls below the 21-day line SMA, it will fall to the market’s previous low of $0.30. On the other side, Cardano will trade in a range for a few days if the 21-day line support fails to hold. ADA’s price is presently oscillating between the moving average lines.
Cardano (ADA) Indicator Analysis
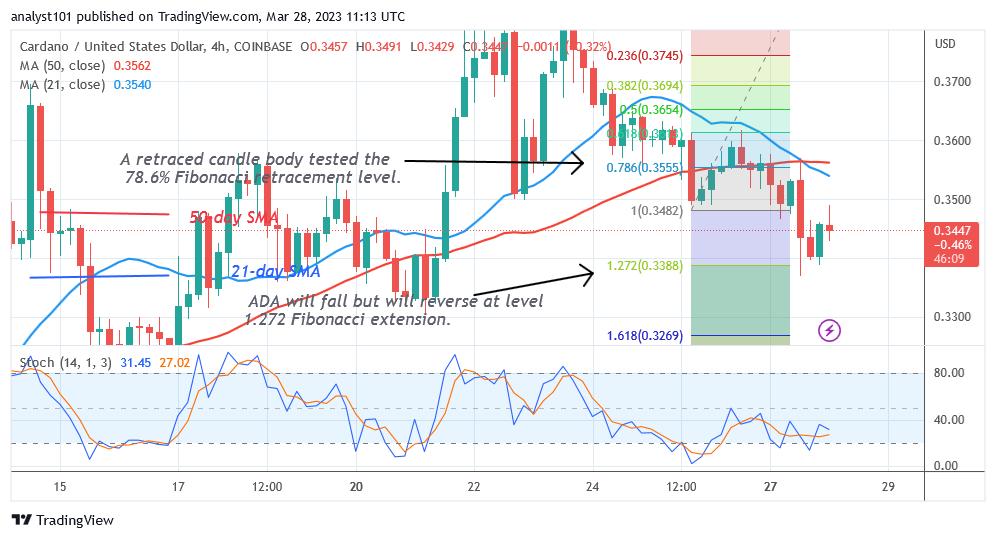
Cardano is at level 48 on the Relative Strength Index for period 14. In the bearish trend zone, the coin is vulnerable to an additional decrease. The price bars show a sideways movement because they are located between the moving average lines. The daily Stochastic’s level 25 represents a slowing of the bullish trend.
Technical indicators:
Major supply zones: $1.0, $1.05, $1.10
Major demand zones: $0.45, $0.40, $0.35
What Is the Next Move for Cardano (ADA)?
Cardano is trading between the moving average lines as it aims for the $0.42 high. A downtrend candle body tested the 78.6% Fibonacci retracement level on March 25. The retracement indicates that ADA will fall but will reverse at level 1.272 Fibonacci extension or $0.338. The market has started moving upward after retesting the 1.272 Fibonacci level.
You can purchase crypto coins here. Buy LBLOCK
Note: Cryptosignals.org is not a financial advisor. Do your research before investing your funds in any financial asset or presented product or event. We are not responsible for your investing results