Ethereum Holds above $1,000 but Risks Further Decline to $881
Estimated Reading Time: 2 minutes
Don’t invest unless you’re prepared to lose all the money you invest. This is a high-risk investment and you are unlikely to be protected if something goes wrong. Take 2 minutes to learn more

Free Crypto Signals Channel
Ethereum Price Long-Term Analysis: Bearish
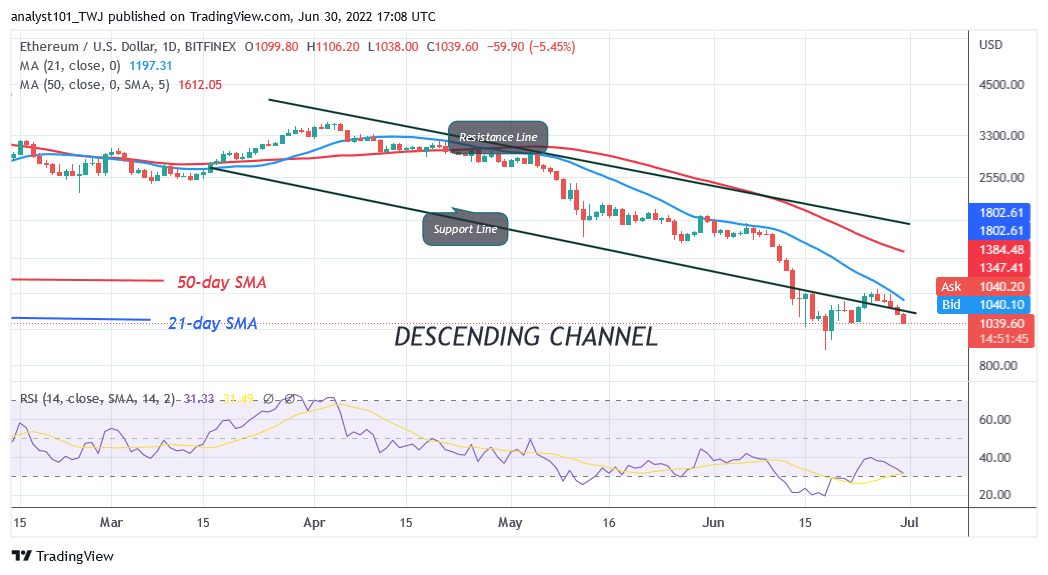
Ethereum’s (ETH) price is in a downward move but risks further decline to $881. Ether is hovering above the $1,047 psychological price level. The current decline has been ongoing since June 26. The bears will attempt to break the current support and Ether will revisit the previous low of $881. Nonetheless, if the selling pressure persists, the bearish momentum will extend to the low of $600. Conversely, if Ether’s price holds above the $1,000 support and rebounds, it will rise to the previous highs . The rebound will propel Ether to the high of $1,703 which is the price level of May 27. Today, ETH/USD has fallen to the low of $1047.60 at the time of writing.
Ethereum Indicator Analysis
Ether is at level 30 of the Relative Strength Index for period 14. The altcoin has fallen to the oversold region of the market. However, it is hovering above the $1,000 psychological price level. The crypto’s price is below the 40% range of the daily stochastic. The market is in a bearish momentum.
Technical Indicators:
Major Resistance Levels – $2, 600, $2,800, $3,000
Major Support Levels – $1.500, $1, 300, $1,100
What Is the Next Direction for Ethereum
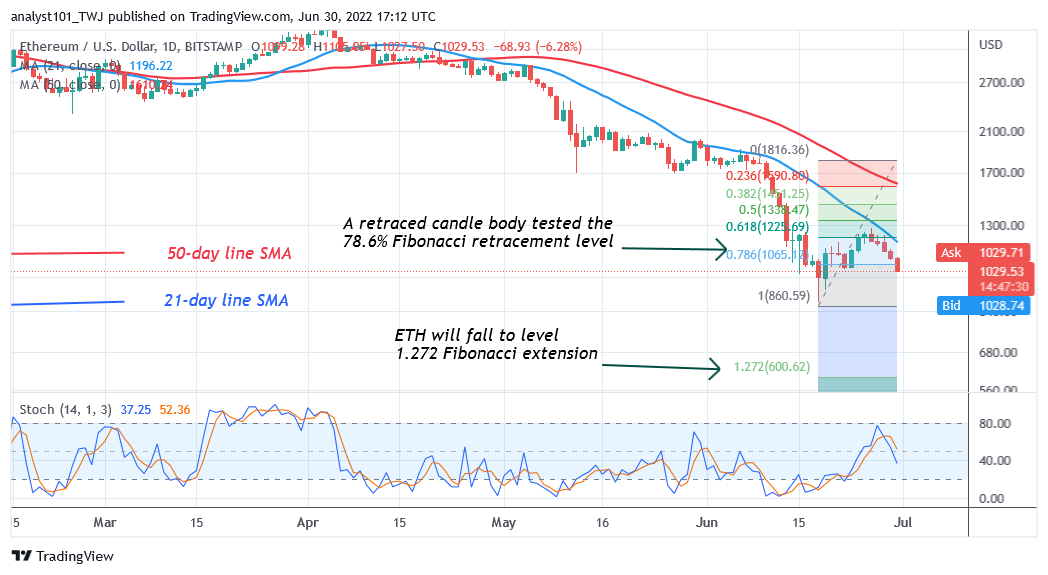
For the past week, Ether has been in a downward move but risks further decline to $881. The selling pressure will resume if price breaks below the current support. Meanwhile, on June 18 downtrend; a retraced candle body tested the 78.6% Fibonacci retracement level. The retracement suggests that ETH will fall but reverse at level 1.272 Fibonacci extension or $600.62.
You can crypto coins here. Buy LBlock
Note: Cryptosignals.org is not a financial advisor. Do your research before investing your funds in any financial asset or presented product or event. We are not responsible for your investing results