Ethereum May Decline as It Fails to Breach the $1,200 High
Estimated Reading Time: 2 minutes
Don’t invest unless you’re prepared to lose all the money you invest. This is a high-risk investment and you are unlikely to be protected if something goes wrong. Take 2 minutes to learn more

Free Crypto Signals Channel
Ethereum Price Long-Term Analysis: Bearish
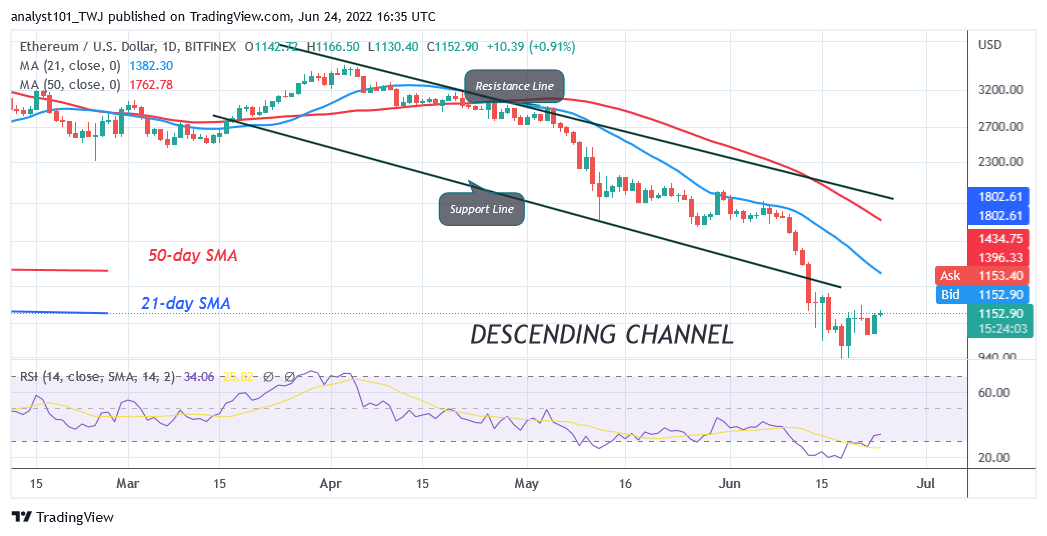
Ethereum’s (ETH) price is in a downtrend as it fails to breach the $1,200 high. Today, Ether has risen to the high of $1,223 at the time of writing. Since June 18, Ether has been fluctuating between $881 and $1,200 price levels. A break above the $1,200 or the 21-day line SMA will propel the coin the reach the high of $1,700. Nonetheless, if price turns down from the 20-day EMA or the resistance level, Ether will decline to $1,000 support. Subsequently, the bears will break the $1,000 support as the altcoin declines to $881 low.
Ethereum Indicator Analysis
Ether is at level 38 of the Relative Strength Index for period 14. The recent upward correction pushes the RSI to rise but Ether is still in the downtrend zone. The crypto’s price bars are far below the moving averages indicating a further decline. The crypto is below the 20% range of the daily stochastic. The altcoin is in the oversold region of the market.
Technical indicators:
Major Resistance Levels – $2, 600, $2,800, $3,000
Major Support Levels – $1.500, $1, 300, $1,100
What Is the Next Direction for Ethereum
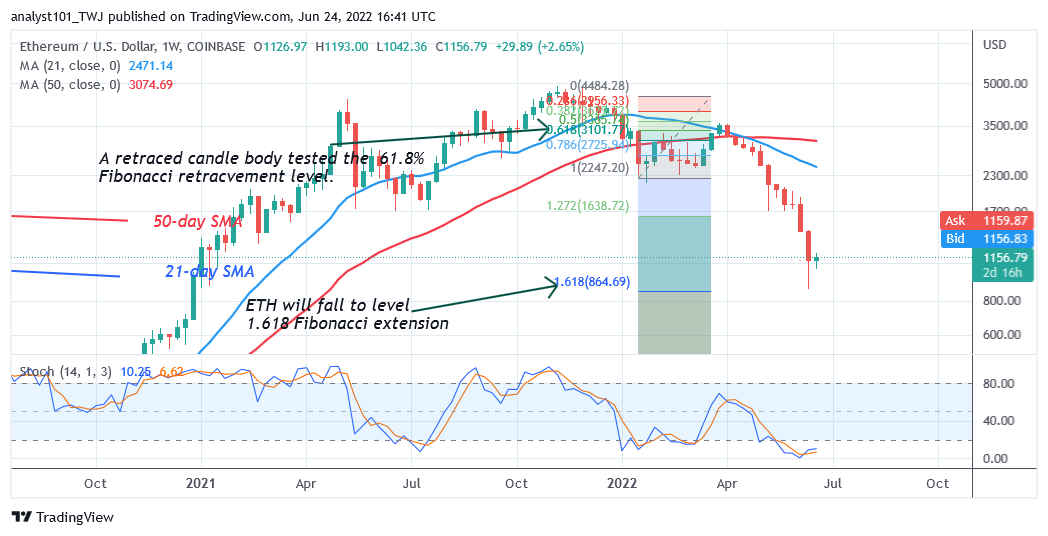
Ethereum is making an upward correction as it may breach the $1,200 high. The Fibonacci tool analysis will be invalidated if the bulls break the recent highs. However, if Ether faces rejection and breaks below the $1000 support, the Fibonacci tool analysis will hold. Meanwhile, on a weekly chart; a retraced candle body tested the 61.8% Fibonacci retracement level. The retracement indicates that ETH will fall to level 1.618 Fibonacci extension or $864.69. From the price action, the coin has retested the Fibonacci extension and resumed upward.
You can crypto coins here. Buy LBlock
Note: Cryptosignals.org is not a financial advisor. Do your research before investing your funds in any financial asset or presented product or event. We are not responsible for your investing results