Bitcoin (BTC/USD) Trade Experiences Unstable Moves at $40,000
Estimated Reading Time: 3 minutes
Don’t invest unless you’re prepared to lose all the money you invest. This is a high-risk investment and you are unlikely to be protected if something goes wrong. Take 2 minutes to learn more

Free Crypto Signals Channel
Bitcoin Price Prediction – April 17
A line of variant re-occurrences has taken in the BTC/USD market activities as the crypto trade experiences unstable moves around the $40,000 line. There is currently a record of high and low values at $40,669 and $40,192, representing the present trading zones of the crypto economy against the USD.
BTC/USD Market
Key Levels
Resistance levels: $42,500, $45,000, $47,500
Support levels: $37,500, $35,000, $32,500
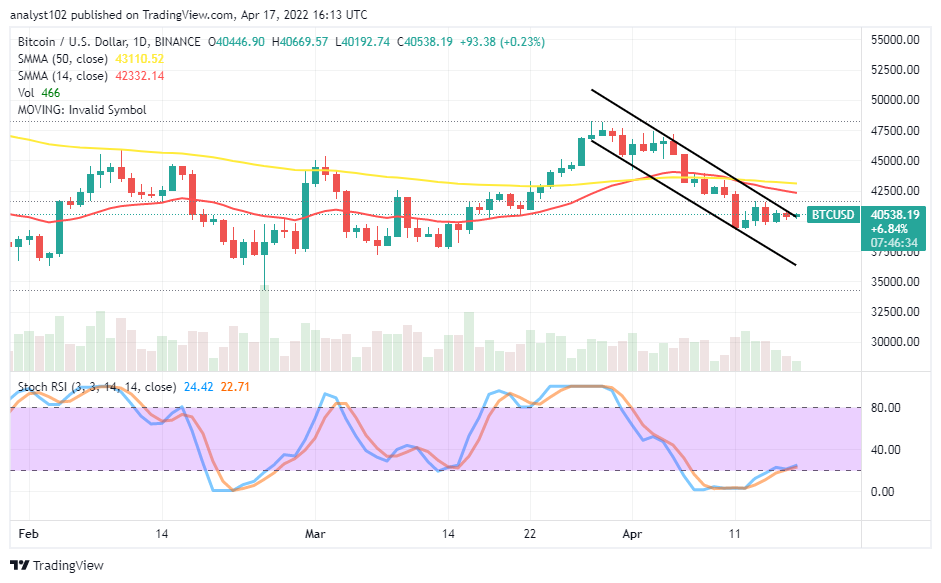
BTC/USD – Daily Chart
The BTC/USD daily chart showcases the crypto-economic trade experiences unstable moves at the $40,000 trading level as the market continues to feature underneath the resistance level of $42,500. The 14-day SMA has crossed the trend line of the 50-day SMA to the southward, placing a markdown sign on the value-line mentioned latterly in this analytics paragraph. The SMA trading indicators are above the current trading zone. The Stochastic Oscillators have moved upward from the depth of the oversold region, trying to close their lines at the range of 20.
Will the BTC/USD market continue not to give a damn to sustainable downward pressures beyond the $40,000 level as the trade experiences unstable moves around it?
It is most likely that the BTC/USD market operation does not give a damn to sustainable downward pressures beyond the $40,000 trading level as the crypto-economic trade experiences unstable moves around the value point. If that bias is eventually valid, a degree of rebounding motions will feature to create enabling stances around support lines, possibly before the $37,500 in the following sessions.
On the downside of the technical analysis, the BTC/USD market short-position placers are not to expect reliable forces to the downside of the $40,000 level presently, as adjudged by the oversold reading situation of the Stochastic Oscillators. In the meantime, an emergence of a smaller-bullish candlestick getting a rejection around the 14-day SMA indicator at the $42,500 line may potentially lift the sellers’ zeal to launch a position.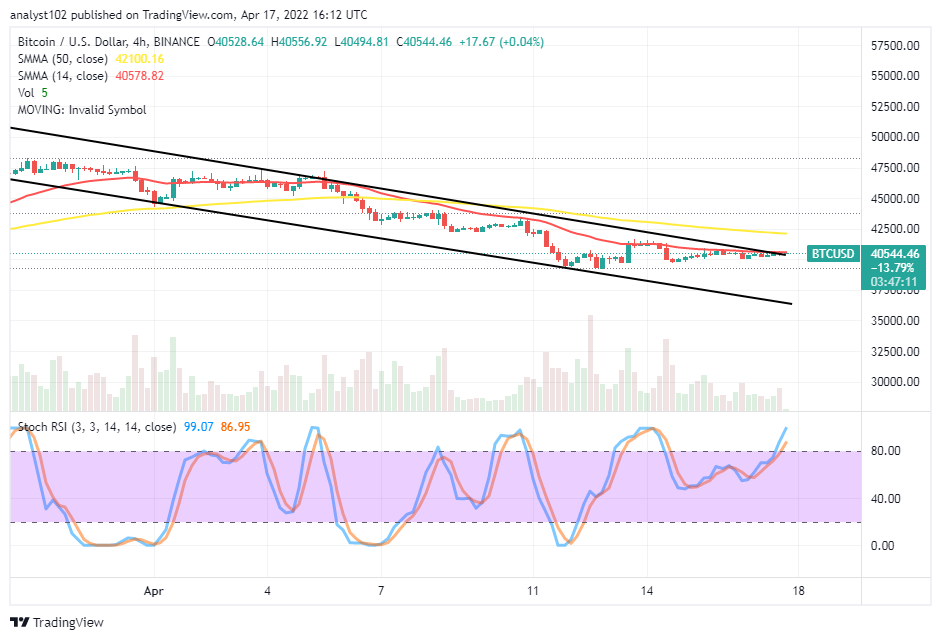
BTC/USD 4-hour Chart
The BTC/USD medium-term chart exhibits the crypto-economic trade experiences unstable moves at $40,000. Price is trading around the conjoined spot of the 14-day SMA indicator and the bearish trend line beneath the 50-day SMA indicator. The Stochastic Oscillators have freshly penetrated the overbought region, pointing toward the northbound direction within. If the two major market players have to exercise less-active force, the market trend will change into a full-range-bound pattern.
Note: Cryptosignals.org is not a financial advisor. Do your research before investing your funds in any financial asset or presented product or event. We are not responsible for your investing results.
You can purchase Lucky Block here. Buy LBlock: