Bitcoin Price Prediction: BTC/USD Breaks Above $49,000 Level
Estimated Reading Time: 3 minutes
Don’t invest unless you’re prepared to lose all the money you invest. This is a high-risk investment and you are unlikely to be protected if something goes wrong. Take 2 minutes to learn more
The Bitcoin price prediction shows that BTC rebounds as the buying interest may increase the bullish movement toward $50k.
Bitcoin Price Prediction – January 11
BTC/USD Long-term Trend: Bullish (Daily Chart)
Key levels:
Resistance Levels: $52,000, $54,000, $56,000
Support Levels: $41,000, $39,000, $37,000
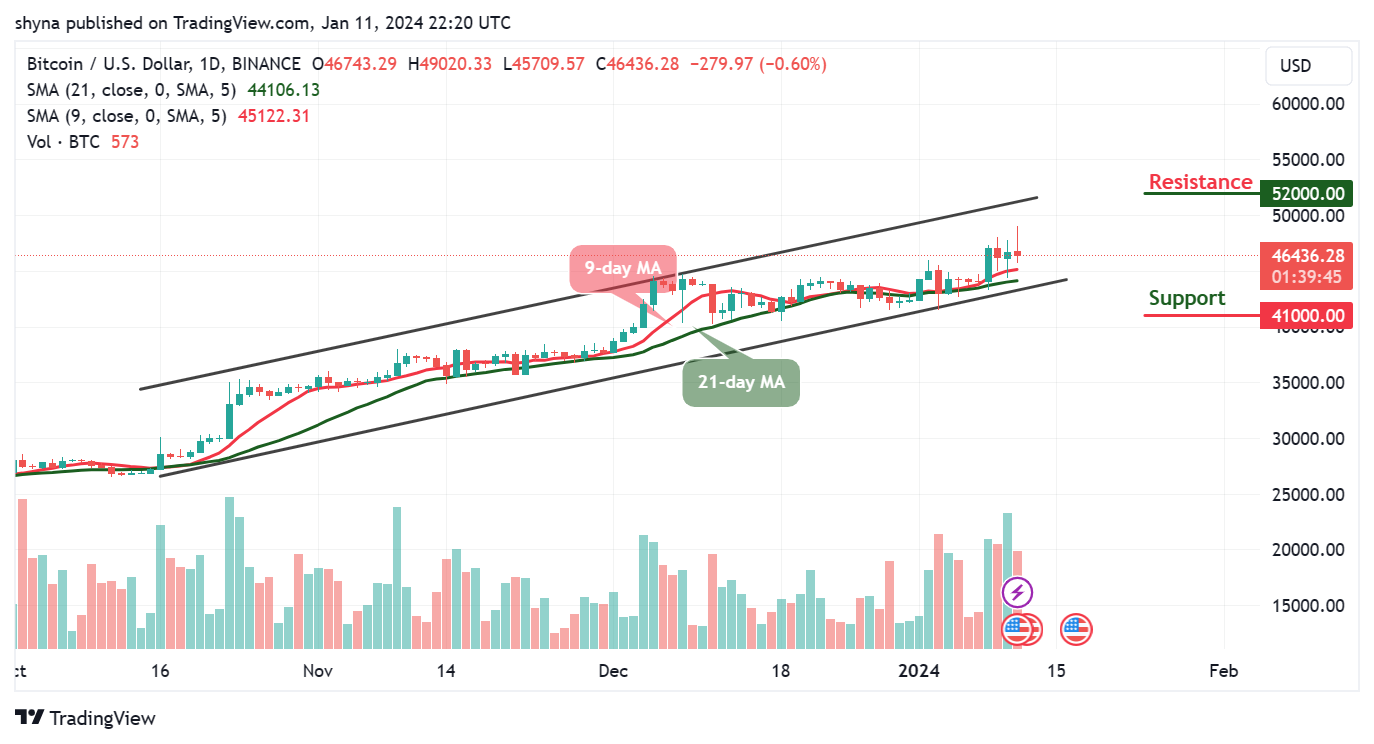
BTC/USD may spike above the upper boundary of the channel as the king coin stays above the 9-day and 21-day moving averages. However, as the market establishes a cross above the channel, the buyers may look for additional resistance levels above the daily high of $49,020.
Bitcoin Price Prediction: BTC Price May Hit $50k Resistance
The Bitcoin price is likely to cross above the upper boundary of the channel as the first digital asset targets the resistance level of $50,000. However, the daily chart reveals that in as much as the 9-day moving average remains above the 21-day moving average, this confirms that the coin will create additional gains. On the contrary, BTC/USD may decline if the price breaks below the moving averages but the market price could rise if the $50,000 resistance is reached.
Nonetheless, the bulls may continue to increase the buying pressure if the buyers push the king coin toward the upper boundary of the channel and could hit the potential resistance level of $49,500. However, if the bears resume into the market, any movement toward the lower boundary of the channel could touch the supports at $41,000, $39,000, and $37,000 while the resistance levels could be found at $52,000, $54,000, and $56,000 respectively.
BTC/USD Medium-term Trend: Bullish (4H Chart)
According to the 4-hour chart, the Bitcoin price will likely drop below the 9-day and 21-day moving averages as the bears return to the market. Meanwhile, if the Bitcoin price heads toward the upper boundary of the channel, the bullish influence could spike and acquire more gains.
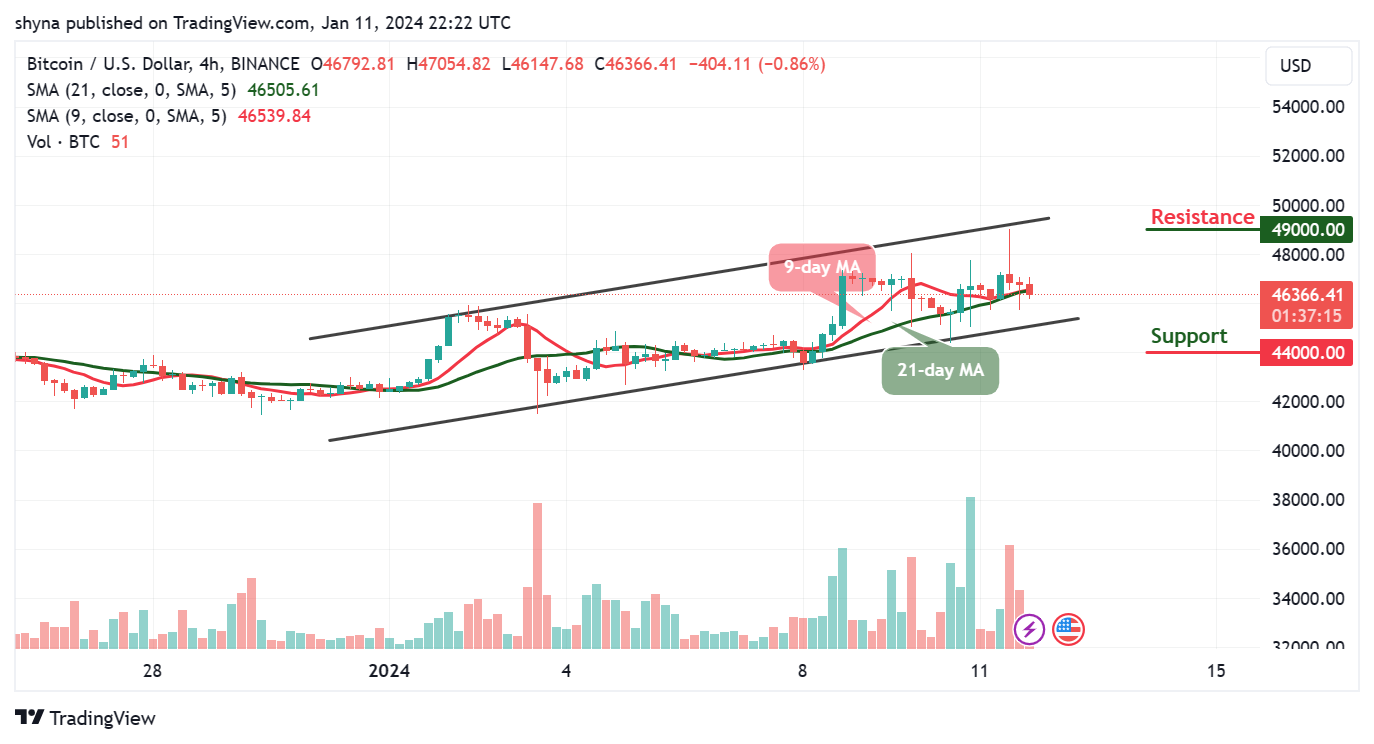
Nevertheless, should the current candle fail to stay above the moving averages, the Bitcoin price may touch the support level of $44,000 and below. Nonetheless, the bulls may need to touch the resistance level of $48,000 to break the potential resistance at $49,000 and above.
You can purchase Bitcoin here. Buy BTC